
Why Does Oil Affect Currencies at All?
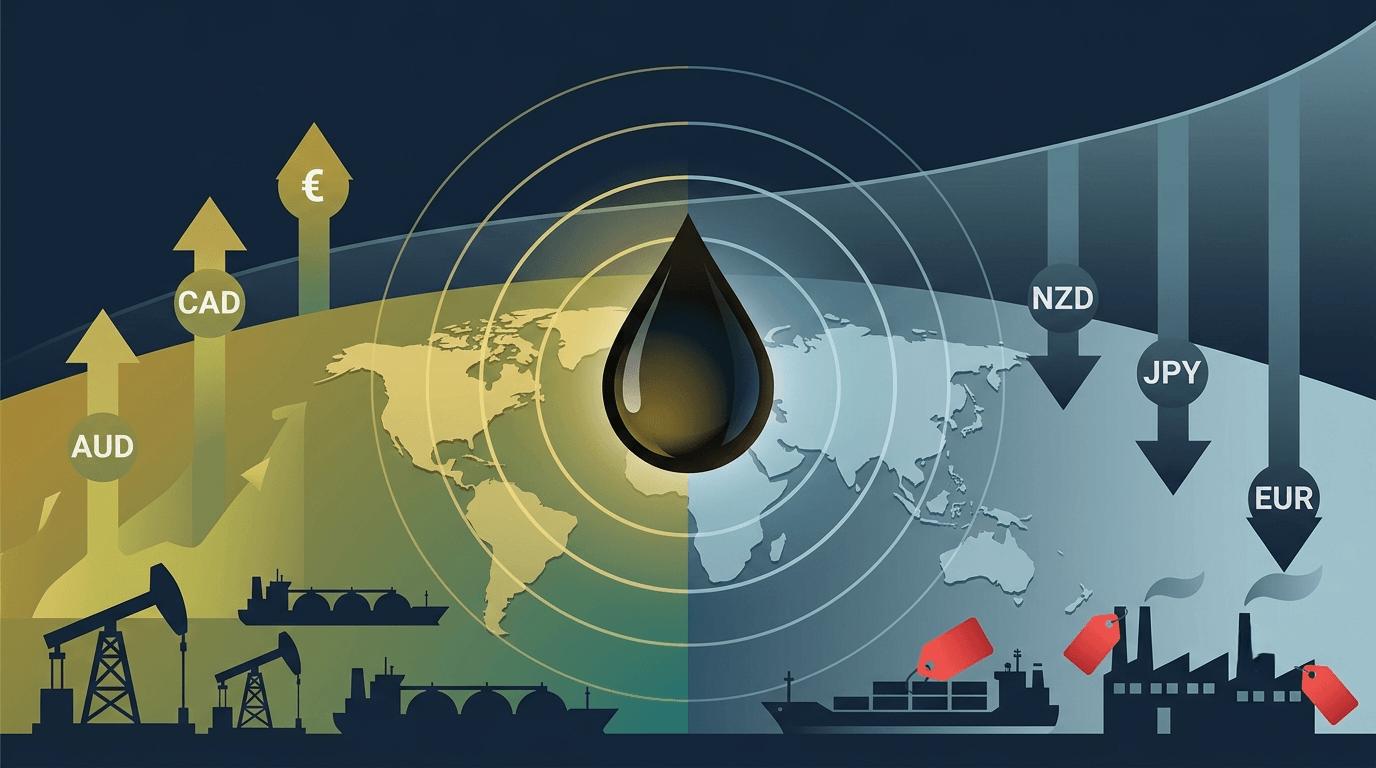
Oil affects currencies because it is the one cost almost every economy must pay — but only some economies get paid for. Every country needs energy to run its factories, transport and households. Nations that produce more oil and gas than they consume earn foreign income when prices rise, while nations that import their energy must send more money abroad to buy the same barrels. That flow of money out of importers and into exporters directly strengthens or weakens their currencies.
Two additional forces amplify the effect. First, oil is priced in U.S. dollars, so when crude gets more expensive, global demand for dollars rises with it. Second, energy costs feed into the price of nearly everything else, pushing up inflation — and inflation forces central banks to change interest rates, which is the single biggest driver of currency values.
In short: oil moves currencies through three channels — trade flows, dollar demand, and interest rates. The rest of this article breaks down how each channel works, why supposedly similar “commodity currencies” now behave in opposite ways, and how analysts track these shifts in practice.
Table of Contents
- The Macro Regime Shift
- Terms of Trade: The Structural Divergence of Exporters vs. Importers
- The Disintegration of the “Commdolls” Block
- Fixed-Income Transmission: The Core Driver of FX Pricing
- The Real Interest Rate Spread and Capital Flow Realignment
- Final Thoughts: Managing Macro Tail Risks
- FAQ: Energy Spikes & Global FX Impacts
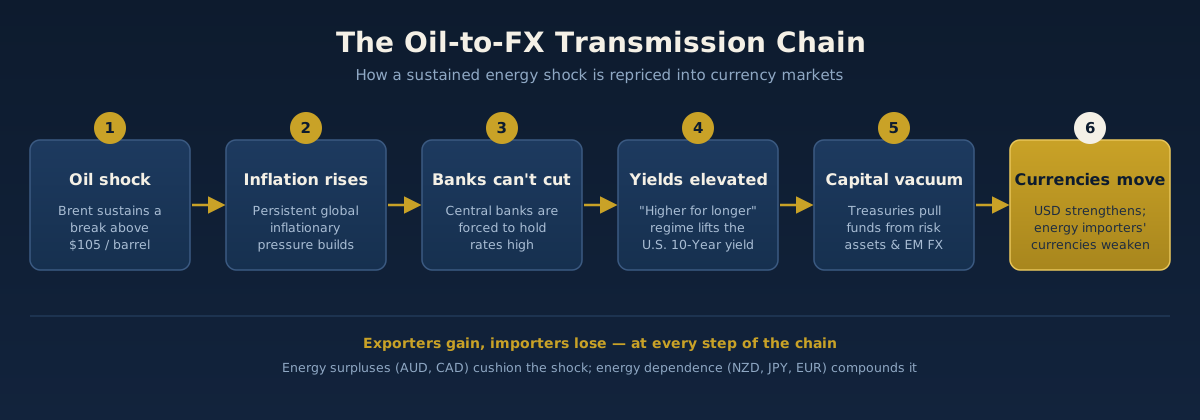
In a nutshell — the transmission chain:
Oil rises → inflation rises → central banks react → yields change → capital flows shift → currencies move
Energy exporters gain and energy importers lose at every step of this chain — which is why an oil shock splits currencies apart instead of moving them together.
The Macro Regime Shift
Global financial markets do not move in a vacuum; they react continuously to structural changes in the cost of capital and primary production inputs. The global economy has shifted out of a technical, trend-following regime and fully entered an exogenous macro-driven volatility environment. The primary catalyst for this profound transformation is a severe energy shock, where Brent crude oil has sustained a break above $105 per barrel due to escalating tensions across critical maritime choke points.
For foreign exchange analysts and macro researchers, an energy crisis of this magnitude fundamentally transforms the global landscape. Higher oil prices are no longer just an isolated story for energy sector equity analysts; they have become an aggressive fundamental force reshaping international inflation expectations, sovereign bond yields, and central-bank monetary policies globally.
To understand these dynamics, market participants must look beyond standard lagging price models, which yield highly deceptive signals during liquidity shocks. Instead, the modern professional framework requires a deep mapping of how energy pricing flows alter the structural foundation of currency valuation.
Terms of Trade: The Structural Divergence of Exporters vs. Importers
The single most powerful economic concept for analyzing an energy crisis is Terms of Trade, which represents the ratio between a country’s export prices and its import prices. An energy shock causes an immediate, massive redistribution of wealth across global economies based purely on whether a nation is a net exporter or a net importer of energy inputs.
When energy costs spike rapidly, a nation that imports its oil and gas experiences a severe contraction in its national terms of trade. Money is effectively drained out of the domestic economy to pay for essential foreign fuel, acting as an immediate tax on corporate productivity and household discretionary spending. This weakens the country’s economic baseline, deteriorates its current account balance, and places intense structural depreciation pressure on its currency.
Conversely, nations with deep domestic energy surpluses experience an immediate terms-of-trade boom. The nominal value of their exports expands rapidly, boosting national income, tax revenues, and corporate profits within the resource sector.
In the G10 currency space, this opens up a massive fundamental gap between resource-rich nations and energy-dependent ones, completely fragmenting historical currency blocks and traditional correlation assumptions. To analyze the exact data behind these structural trade shifts and balance of payments adjustments, international desks monitor the official OECD Terms of Trade Data.
The Disintegration of the “Commdolls” Block
For years, trading desks routinely grouped the Australian Dollar (AUD), the New Zealand Dollar (NZD), and the Canadian Dollar (CAD) into a single, cohesive category known as the Commdolls, or commodity currencies. The prevailing assumption was that a broad-based rise in global raw materials would support all three currencies equally against the major funding currencies.
During a true geopolitical energy shock, this oversimplified grouping breaks down completely. Institutional capital does not trade them as a block; instead, it aggressively rewards currencies backed by direct energy surpluses while severely penalizing those exposed to rising input costs.
| Currency Factor | AUD (Australia) | NZD (New Zealand) | CAD (Canada) |
|---|---|---|---|
| Energy Profile | Net Exporter (LNG, Coal) | Net Importer (Crude Oil) | Net Importer (Crude Oil) |
| Core Sensitivity | Industrial Growth and China | Risk Sentiment and Carry Unwinds | Oil Prices and Yield Spreads |
| Macro Mechanism | Resource Cushion vs. Growth Drag | Double-Edged Terms of Trade Hit | Oil vs. Dollar Safe-Haven Flow |
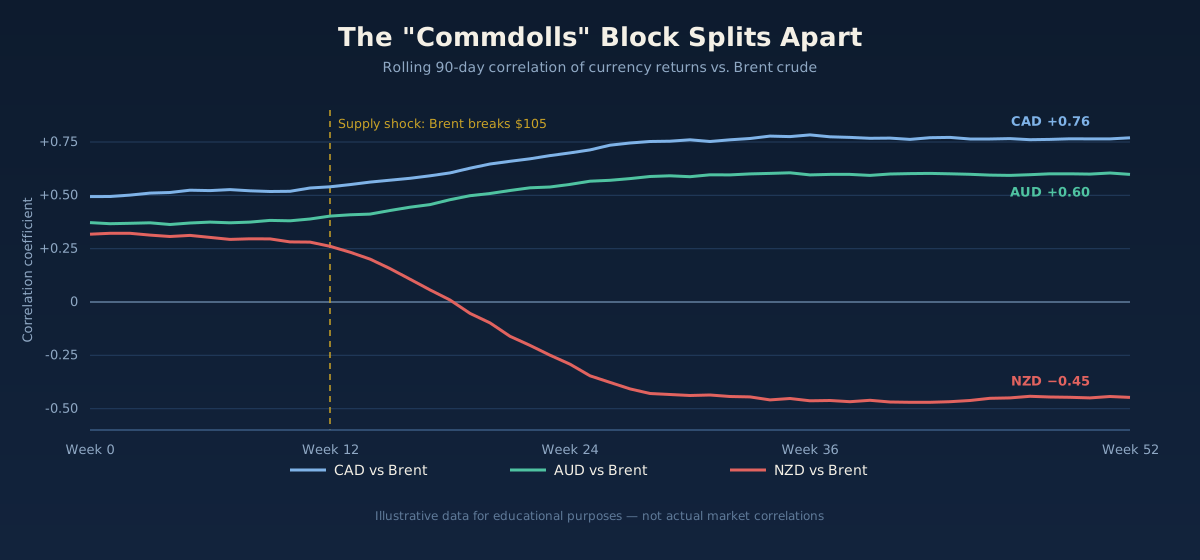
The most vivid example of this divergence is the relationship between the AUD and the NZD. While Australia benefits from extensive LNG and coal exports, acting as a natural structural hedge against the energy crisis, New Zealand is a net energy importer. The Kiwi economy is heavily anchored to soft agricultural and dairy exports, which do not experience an automatic price increase during a geopolitical supply shock.
When oil surges, New Zealand’s terms of trade deteriorate rapidly because their dairy production and international shipping costs scale up dramatically, while their actual export prices remain stagnant or decline due to global demand destruction.
This creates a perfect fundamental divergence. Because the NZD operates with significantly lower liquidity than the AUD in the interbank market, its price action tends to be far more erratic and prone to aggressive downward momentum shifts during risk-off corrections.
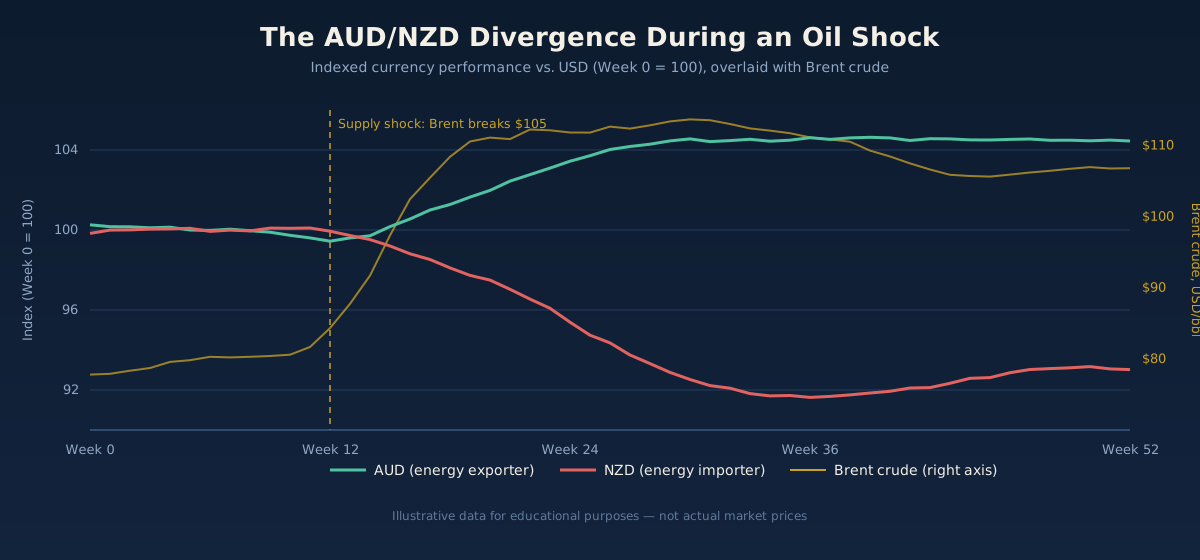
Rather than analyzing AUD/USD or NZD/USD against a highly volatile U.S. Dollar, institutional desks frequently express this fundamental divergence by tracking the AUD/NZD cross rate. This cross filters out broad Dollar movements and focuses purely on the structural divergence between Australia’s energy insulation and New Zealand’s soft-commodity vulnerability.
Fixed-Income Transmission: The Core Driver of FX Pricing
To comprehend the macro transmission mechanism of this energy crisis, one must constantly track fixed-income markets, specifically sovereign bond yields. Sustained $105+ oil generates persistent global inflationary pressure, which directly limits the capacity of central banks to cut interest rates, forcing the market to adopt a structural higher-for-longer rate regime.
When the U.S. 10-Year Treasury Yield breaks out to the upside, it acts as a massive global financial vacuum. Higher risk-free yields in the world’s most secure and liquid asset market pull capital out of international equity desks, emerging markets, and risk-sensitive G10 commodity currencies. Even if a country like Canada or Australia experiences nominal export improvements due to high raw material pricing, the international capital account flows dominate the trade balance flows.
If U.S. real yields rise faster than domestic bond yields in Sydney or Ottawa, large global funds scale back their local investments and reallocate capital into U.S. Dollars to capture clean, low-risk yields. Therefore, tracking sovereign yield spreads is an important step for any analyst attempting to capture directional moves during an energy-driven macro cycle. To observe how these macro monetary tightening regimes are adjusting internationally, analysts follow the real-time changes on the Trading Economics Central Banks Interest Rates Tracker.
The Real Interest Rate Spread and Capital Flow Realignment
The relationship between energy price shocks and capital account reallocations becomes visible when analyzing real interest rate differentials. A common market misconception is that nominal interest rate hikes are enough to defend a currency during a period of rising global costs. In reality, institutional capital tracks the inflation-adjusted return, meaning that if a central bank raises rates but inflation rises faster due to high domestic energy dependency, the real yield actually contracts, driving capital away.
This dynamic explains why energy-importing regions often suffer currency depreciation even when their central banks adopt a hawkish tone. The markets recognize that these central banks are caught trapped in stagflation, forced to choose between raising rates to defend the currency or holding rates steady to protect a weak domestic consumer.
By contrast, energy-exporting nations can sustain higher real yields because their export revenues help absorb the inflationary shock, creating a structural advantage that reorients international capital flows. This divergence highlights why tracking the interaction between real yields and terms of trade is critical to understanding long-term trends in the foreign exchange complex.
Final Thoughts: Managing Macro Tail Risks
The structural fragmentation of traditional currency relationships proves that analyzing markets during an energy crisis requires absolute ideological flexibility. Assuming that all commodity-linked assets will rise together when oil spikes is a fundamental error that ignores terms of trade dynamics and institutional capital positioning. In the current market regime, capital does not flow to where the raw materials are simply extracted; it flows to where the real yield advantage resides and where economic structures are insulated from inflationary input shocks.
For professional analysts, navigating these cross-currents requires a rigid data-driven framework. By isolating the specific vulnerabilities of energy importers like New Zealand and pairing them against insulated energy exporters, you can explain real macro trends while filtering out broad market noise. Survival in this high-volatility environment depends entirely on your ability to look past short-term chart patterns and master the underlying fixed-income and trade drivers that dictate long-term global liquidity.
FAQ: Energy Spikes & Global FX Impacts
1. Why does an energy crisis cause a breakdown in historical currency blocks like the “Commdolls”?
Traditional currency classifications assume that all commodity currencies move together, but an energy shock creates a severe divide based on input costs versus export revenues. Currencies like CAD and AUD are backed by vast energy surpluses, such as oil, gas, and coal, allowing their economies to absorb higher prices. Currencies like the NZD, despite being classified as commodity-linked due to dairy and agriculture, are net energy importers. Higher oil prices increase their domestic production costs while draining national wealth, causing institutional capital to separate them completely.
2. How does the AUD/NZD cross pair filter out broad market noise during an energy shock?
Tracking a currency against the U.S. Dollar forces an analysis to take on heavy directional exposure to global safe-haven flows and Federal Reserve policy shifts. By utilizing the AUD/NZD cross rate, an analyst can completely eliminate the U.S. Dollar factor. This approach isolates the pure macroeconomic divergence between Australia, an energy exporter insulated by LNG and coal revenues, and New Zealand, an energy importer suffering a terms-of-trade hit due to rising shipping and production costs.
3. Why do rising oil prices paradoxically strengthen the U.S. Dollar even though the U.S. is a major consumer?
While the United States is a massive consumer of energy, it has also become one of the world’s largest domestic producers of oil and natural gas, giving it far more structural insulation than energy-dependent regions like Europe or Japan. Furthermore, because oil is priced globally in Greenbacks, a supply crisis expands the transaction demand for U.S. Dollars. When geopolitical risks accelerate, global capital enters a flight-to-quality mode, leaving cyclical assets and crowding into highly liquid U.S. Treasury markets.
4. What is the significance of the “Higher for Longer” interest rate regime for currency correlations?
Persistent energy inflation acts as an ongoing hurdle for central banks wanting to lower borrowing costs. When oil remains structurally elevated, inflation expectations rise, forcing the Federal Reserve to maintain high interest rates to cool the economy. This higher-for-longer regime keeps U.S. bond yields elevated, widening the real interest rate spread against other central banks that cannot afford to keep rates tight due to weaker domestic consumers, which structurally supports the U.S. Dollar.
5. How should analysts interpret a scenario where crude oil rallies but energy-dependent equity indices remain stable?
A divergence where oil surges but equity markets do not immediately sell off usually suggests that the market believes the inflation spike is temporary or that corporate profit margins are successfully passing costs down to the consumer. However, if the real yield spread begins to climb concurrently, it indicates that the fixed-income market is pricing in a more permanent restrictive monetary response. In the FX complex, the bond market’s reaction will often carry more weight than short-term equity stability, making yield spreads the primary signal to follow.
Disclaimer: The content of this article is intended for informational purposes only and should not be considered professional advice.