Section 1 / 5
What are Momentum Indicators?
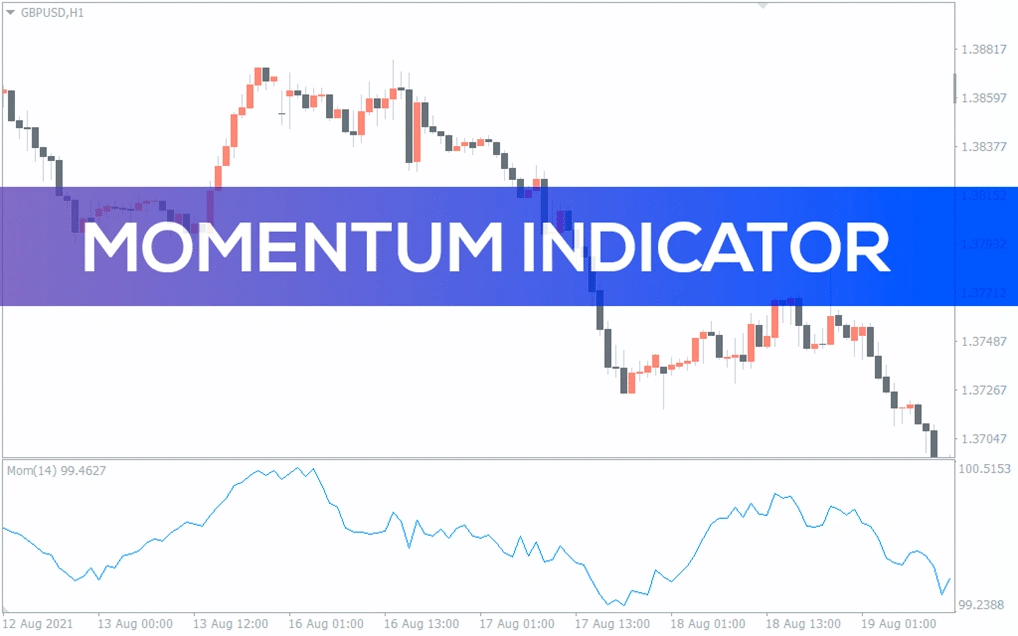
Momentum indicators are a set of technical indicators used in technical analysis to measure the strength of a trend and the likelihood of its continuation. They help traders and investors identify overbought or oversold conditions in the market and provide signals for buying or selling securities.
One of the most popular momentum indicators is the Relative Strength Index (RSI). It compares the magnitude of recent gains to recent losses to determine whether a stock is overbought or oversold. If the RSI is above 70, the security is considered overbought, and if it is below 30, it is oversold. Traders often use the RSI to confirm a trend and identify potential reversal points.
Another momentum indicator is the Moving Average Convergence Divergence (MACD). It is a trend-following indicator that uses two moving averages, a fast one and a slow one, to generate buy and sell signals. When the fast-moving average crosses above the slow-moving average, it signals a buy, and when it crosses below, it signals a sell. Traders often use the MACD to confirm trends and identify potential reversals.
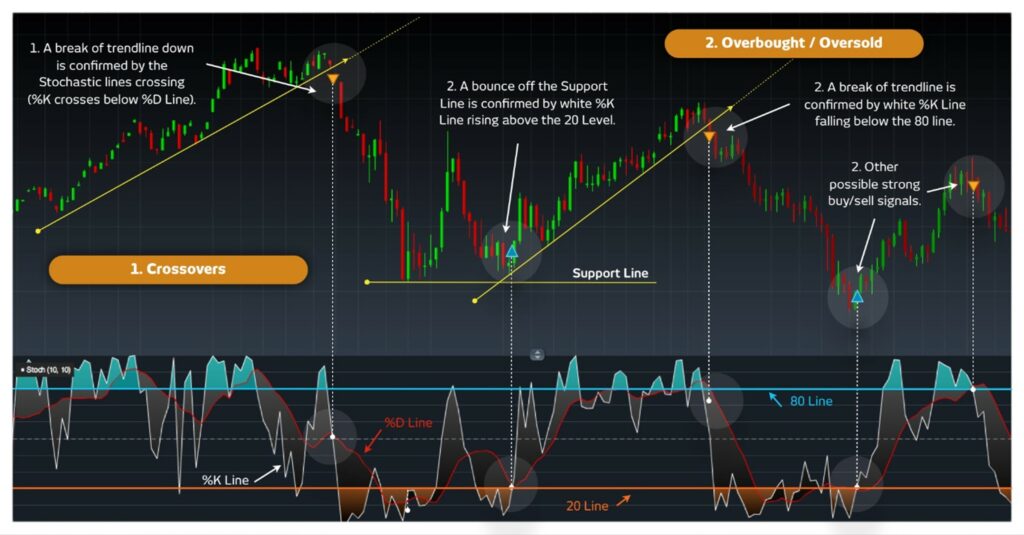
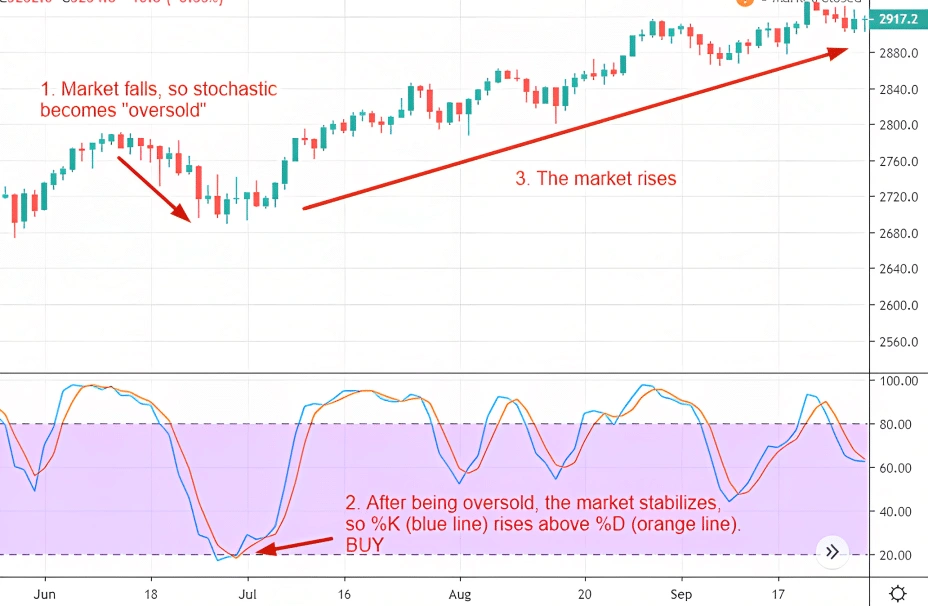
Stochastics is another momentum indicator that measures the momentum of a stock price relative to its high and low range over a specified period. It generates buy and sell signals based on overbought or oversold conditions, similar to the RSI.
Momentum indicators are useful in identifying potential trend reversals and confirming existing trends. However, like all technical indicators, they have their limitations and should be used in conjunction with other tools and analysis techniques to make informed trading decisions.