

Section 1 / 8
What is MACD Indicator?
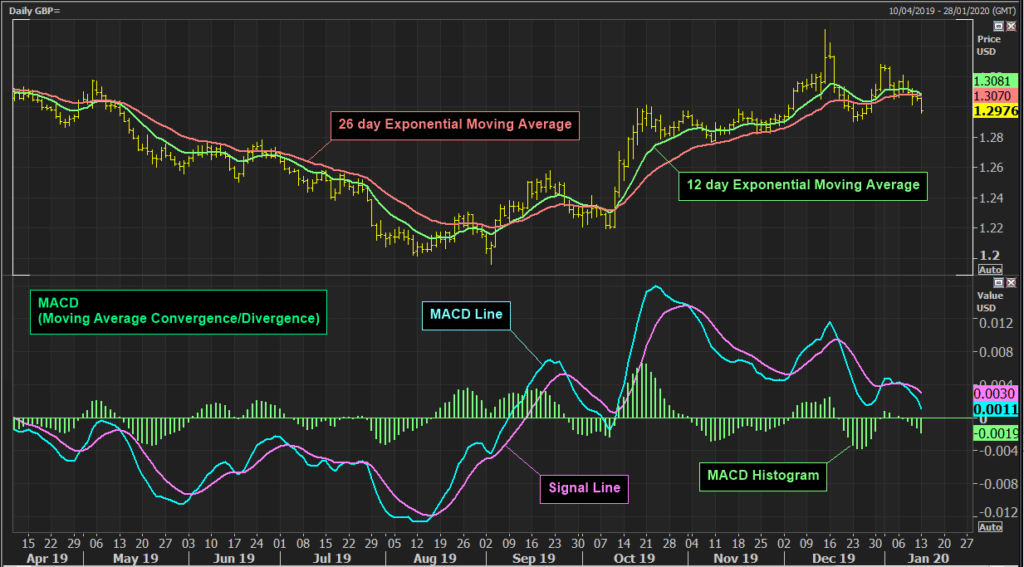
MACD stands for Moving Average Convergence Divergence. It is a technical analysis tool used to analyse trends in stock prices. The MACD line is the difference between two exponential moving averages of closing prices. The Signal line is a moving average of the MACD line. The Average Convergence Divergence (MACD) is a momentum indicator that is used to identify changes in the strength, direction, momentum, and duration of a trend in a stock’s price. The MACD line is plotted against the signal line, which is a 9-day exponential moving average of the MACD line. When the MACD line crosses the signal line, it is an indication that the trend is changing.
Section 2 / 8
MACD Formula
The MACD formula is based on the difference between two exponential moving averages (EMAs) of different periods.
Here’s the MACD formula:
MACD Line = 12-day EMA – 26-day EMA
Signal Line = 9-day EMA of the MACD Line
Histogram = MACD Line – Signal Line
Where:
- EMA stands for Exponential Moving Average, which is a type of moving average that places more weight on recent prices compared to older prices.
- The 12-day EMA represents the fast-moving average, while the 26-day EMA represents the slow-moving average.
- The Signal Line is a 9-day EMA of the MACD Line.
- The Histogram represents the difference between the MACD Line and the Signal Line, and it is plotted as a bar chart that oscillates above and below a zero line.
Section 3 / 8
How to Read MACD Average Crossovers
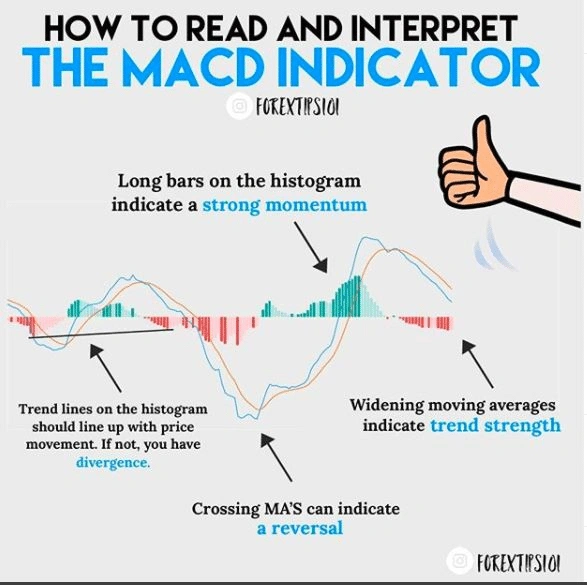
Reading MACD Average Crossovers is a great way to identify potential trading opportunities. The Moving Average Convergence Divergence (MACD) indicator uses two different moving averages to measure momentum in the markets. When the two moving averages cross over each other, it is known as a signal line crossover. A bearish crossover occurs when the shorter-term moving average crosses below the longer-term moving average. This is a bearish signal, indicating that momentum is moving in a downward direction. On the other hand, a bullish crossover occurs when the shorter-term moving average crosses above the longer-term moving average. This is a bullish signal, indicating that momentum is moving in an upward direction.
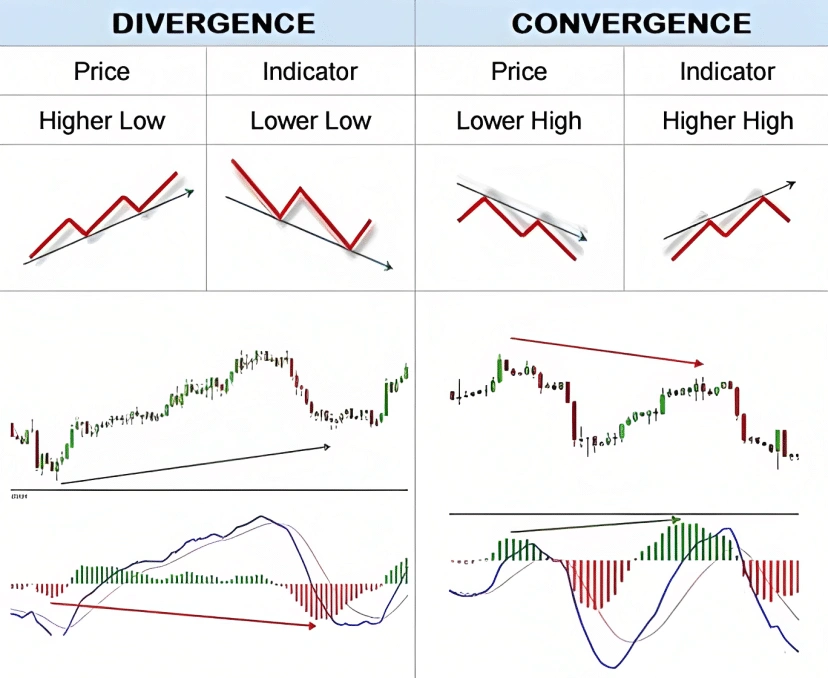
In addition to signal line crossovers, traders can also look for bullish or bearish divergences. A bullish divergence occurs when the MACD indicator is making higher highs, while the price of the underlying asset is making lower lows. This is a bullish signal, indicating that the asset may be due for a price increase. On the other hand, a bearish divergence occurs when the MACD indicator is making lower lows, while the price of the underlying asset is making higher highs. This is a bearish signal, indicating that the asset may be due for a price decrease.
By paying attention to signal line crossovers and divergences, traders can identify potential trading opportunities and make informed decisions about when to enter and exit the market.
Section 4 / 8
How to Read a MACD Histogram
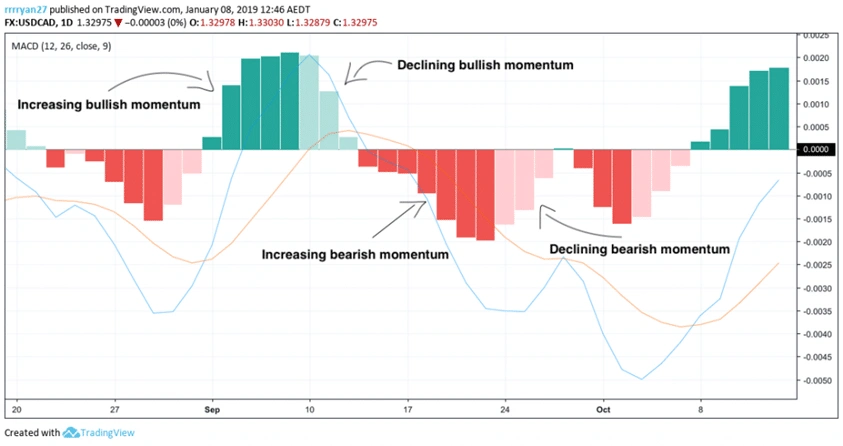
Reading a MACD histogram is a great way to identify price movements and potential trading opportunities. The MACD histogram is a visual representation of the difference between the MACD line and the signal line. The MACD line is the 12-day exponential moving average (EMA) minus the 26-day EMA. The signal line is the 9-day EMA of the MACD line. The MACD histogram is the vertical distance between the MACD line and the signal line.
When the MACD histogram is above the zero line, it indicates that the 12-day EMA is above the 26-day EMA and the market is in an uptrend. Conversely, when the MACD histogram is below the zero line, it indicates that the 12-day EMA is below the 26-day EMA and the market is in a downtrend.
Bullish divergences occur when the MACD histogram is making lower lows while the price is making higher lows. This indicates that the momentum of the market is weakening and that the price could be due for a reversal. Conversely, bearish divergences occur when the MACD histogram is making higher highs while the price is making lower highs. This indicates that the momentum of the market is increasing and that the price could be due for a reversal.
By reading a MACD histogram, you can identify potential price movements and trading opportunities. By understanding the relationship between the MACD histogram and the price movement, you can gain a better understanding of the market and make more informed trading decisions.
Section 5 / 8
What are MACD Divergence?
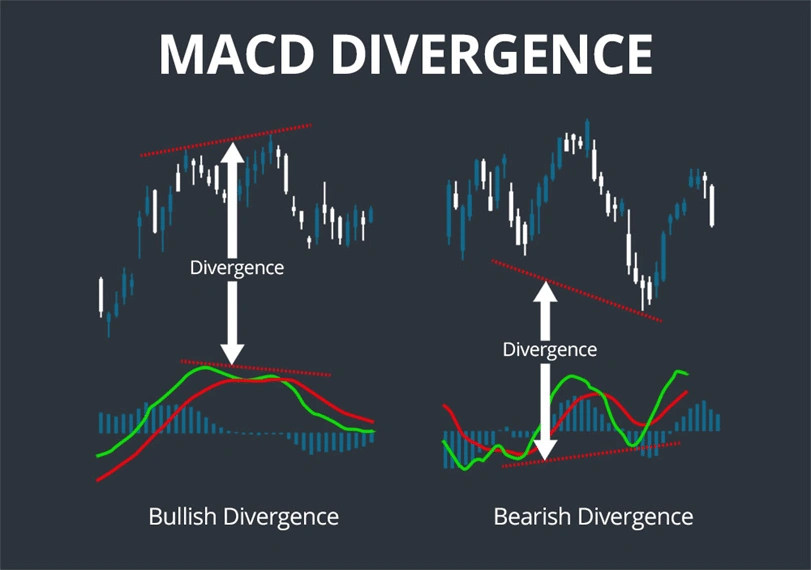
MACD Divergence is a lagging indicator that can be used to help identify potential buy and sell signals in the stock market. It is based on the Moving Average Convergence Divergence (MACD) chart, which is a technical indicator that compares two moving averages of a security’s price. When the MACD chart shows a divergence, it can be a sign of a potential buy or sell signal. A buy signal is when the MACD chart shows a divergence between the two moving averages, indicating that the security’s price is likely to rise. A sell signal is when the MACD chart shows a divergence between the two moving averages, indicating that the security’s price is likely to fall. By watching for these divergences, investors can gain insight into when to enter and exit the market.
Section 6 / 8
What are MACD Convergence?
MACD convergence refers to a situation where the MACD line and the signal line move towards each other, eventually crossing over. This indicates a potential trend reversal in the market, as the momentum is shifting in the opposite direction.
Convergence occurs when the MACD line is moving closer to the signal line, while both lines are moving in the same direction. This implies that the trend is strong and likely to continue, but the momentum is slowing down.
There are two types of MACD convergence: bullish convergence and bearish convergence. Bullish convergence occurs when the MACD line moves towards the signal line from below, while the price continues to move downwards. This indicates that the downtrend may be losing momentum and a potential reversal to the upside is possible. Bearish convergence, on the other hand, occurs when the MACD line moves towards the signal line from above, while the price continues to move upwards. This indicates that the uptrend may be losing momentum and a potential reversal to the downside is possible.
Section 7 / 8
Centerline Crossovers
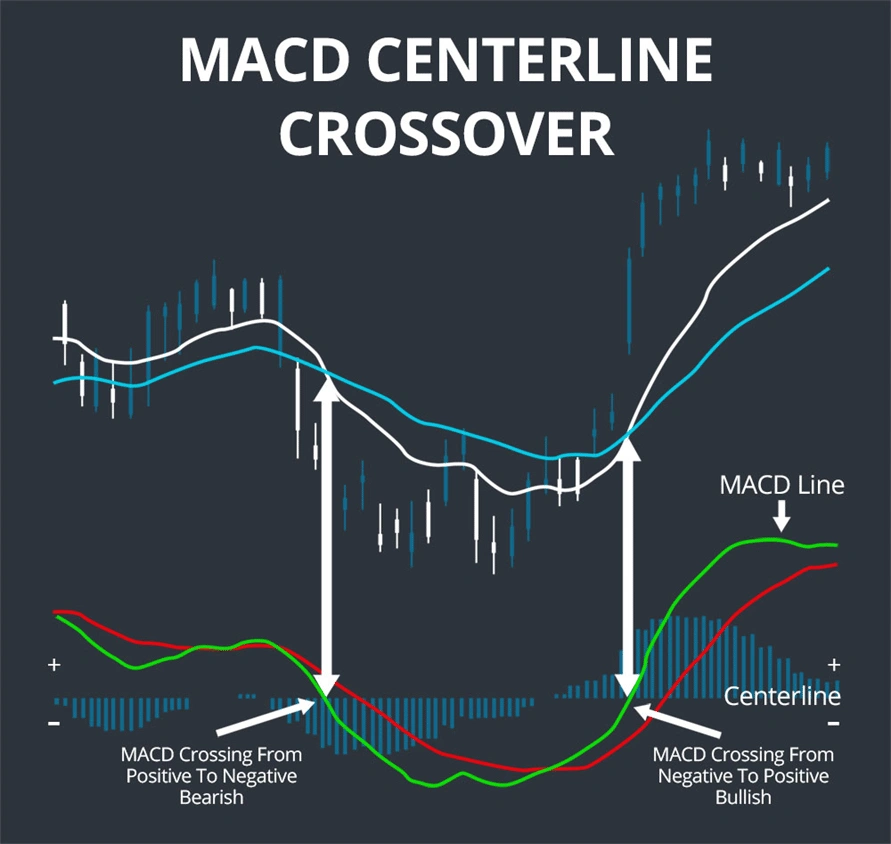
The centerline of the MACD is the point at which the MACD line and the signal line intersect. When the MACD line crosses above the centerline, it indicates that the stock price is gaining momentum to the upside. This is a bullish signal. On the other hand, when the MACD line crosses below the centerline, it indicates that the stock price is losing momentum and may start to trend downwards. This is a bearish signal.
Centerline crossovers can be used to confirm trends or to signal potential trend reversals. For example, if a stock is in a bullish trend and the MACD line crosses above the centerline, it can be seen as confirmation of the bullish trend. Conversely, if a stock is in a bearish trend and the MACD line crosses below the centerline, it can be seen as confirmation of the bearish trend.
Section 8 / 8
Limitations of MACD Indicator
One of the main limitations of MACD is that it is a lagging indicator. This means that it may not provide timely signals for traders to take action. Since MACD is based on moving averages, it takes into account past price movements rather than current or future ones. As a result, MACD may not be able to provide accurate signals in fast-moving markets or during periods of high volatility.
Another limitation of MACD is that it can be prone to false signals. MACD generates signals when the MACD line crosses the signal line, indicating a change in trend. However, these signals can be misleading if the market is in a sideways or ranging market, as there may be frequent crossovers that do not indicate a significant change in trend. Traders need to be aware of this and use other indicators or analysis to confirm MACD signals.
Additionally, MACD may not work as well in certain market conditions or asset classes. For example, some traders may find that MACD works better for stocks than for currencies or commodities. The effectiveness of MACD may also depend on the time frame being used, as different time frames can produce different signals and results.