
Section 1 / 14
Introduction to Fibonacci Trading Strategy
Fibonacci retracement is a method in technical analysis employed in financial markets to pinpoint possible support and resistance zones. It relies on the Fibonacci sequence and the golden ratio, aiding traders in predicting where a price may stall or change direction during a trend.
The Fibonacci trading strategy builds on this concept by analysing and executing trades based on the Fibonacci sequence—a series where each number is the sum of the two preceding ones (0, 1, 1, 2, 3, 5, 8, 13, 21, 34, etc.). Traders use Fibonacci retracements to identify likely support and resistance levels in an asset’s price movement. These levels are calculated by measuring the vertical distance between a significant high and low in the asset’s price and then dividing that range by key Fibonacci ratios (23.6%, 38.2%, 50%, 61.8%, and 100%). When a price retraces to one of these levels following a strong upward or downward move, it can signal a possible trend reversal, providing traders with cues for potential entry or exit points.
Section 2 / 14
Origins of Fibonacci or the “Golden Ratio”
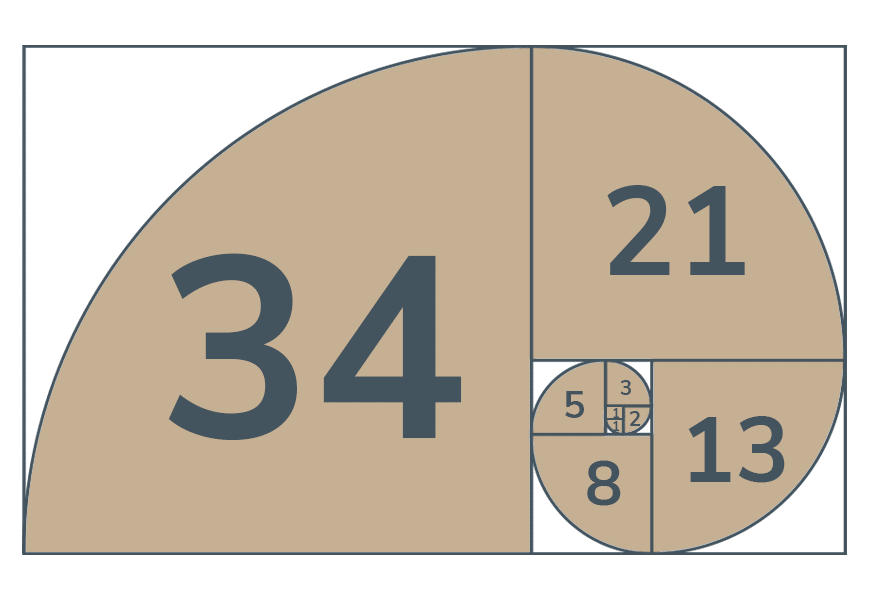
The origin of Fibonacci numbers and the golden ratio can be traced back to the ancient mathematician Leonardo of Pisa, also known as Fibonacci. In his book “Liber Abaci,” published in 1202, he introduced the sequence of numbers now known as the Fibonacci sequence. The sequence starts with 0 and 1, and each subsequent number is the sum of the two preceding numbers. This sequence appears in many natural phenomena, including the growth patterns of plants and animals.
The golden ratio is a mathematical concept that describes the relationship between two quantities where the ratio of the smaller quantity to the larger one is the same as the ratio of the larger to the sum of both. The golden ratio is approximately equal to 1.6180339887 and is denoted by the Greek letter phi (φ). The golden ratio has been observed in a variety of natural and man-made structures and is considered a universal principle of beauty and harmony.
Figures 1: How the Fibonacci series develops and the first 15 numbers in the sequence
Section 3 / 14
How is Fibonacci Relevant to Financial Markets?
The Fibonacci sequence is relevant to financial markets because it is used to identify potential levels of support and resistance for a financial asset’s price. The sequence is derived from adding the previous two numbers to get the next number, starting from 0 and 1. In technical analysis, traders and investors use Fibonacci retracements to identify levels at which an asset’s price may experience support or resistance after a price move. These levels are determined by calculating the percentage retracement of the price move and finding the corresponding level in the Fibonacci sequence. The most commonly used levels are 23.6%, 38.2%, 50%, 61.8% and 100%. These levels are considered significant because they often correspond to key psychological levels in trading and can serve as potential areas for traders to enter or exit positions.
Section 4 / 14
Fibonacci Retracement and Extension
Fibonacci retracement and extension is a technical analysis tool that uses horizontal lines to identify potential levels of support and resistance in an asset’s price movement. By plotting the price swings from high to low, traders can use the Fibonacci ratio of 23.6%, 38.2%, 50%, 61.8%, and 100% to forecast where the price may retrace or extend to. The Fibonacci retracement levels are used to determine the support levels, while the Fibonacci extension levels are used to identify potential profit-taking levels. These levels are widely used in forex, stocks, and cryptocurrency trading to make informed trading decisions and increase the chances of success.
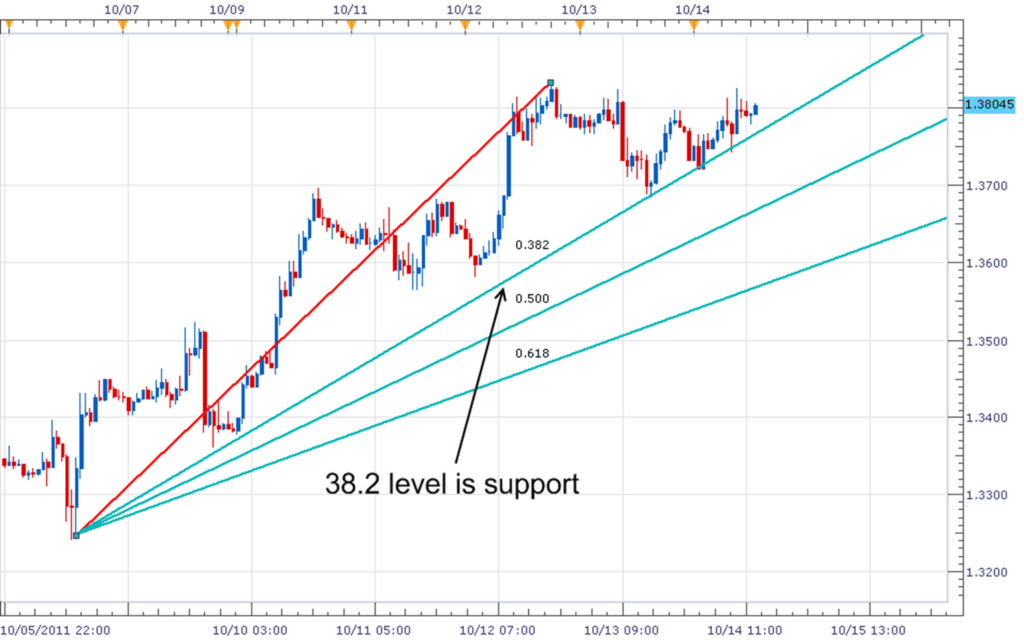
What is Fibonacci Retracement?
Fibonacci retracement is a technical analysis tool that uses horizontal lines to indicate areas of support or resistance at the key Fibonacci levels before the price continues in the original direction. The most commonly used Fibonacci retracement levels are 38.2%, 50%, and 61.8%. The Fibonacci retracement level gives technical traders a good edge in the market. The Fibonacci retracement tool is one of the most common trading tools on charting software – MT4.
For example, let’s say an asset is trading at $100, and over a period of time, the price rises to $150. To plot the retracement levels, you would first find the difference between the high and low prices: $150 – $100 = $50. Then, you would multiply that difference by the key Fibonacci ratios (0.382, 0.5, and 0.618) and add the result to the low price.
38.2% retracement level: $100 + ($50 x 0.382) = $119.10
50% retracement level: $100 + ($50 x 0.5) = $125
61.8% retracement level: $100 + ($50 x 0.618) = $130.90
These levels would then be plotted on a chart horizontally and used as potential areas of support or resistance. If the price of the asset were to retrace and reach one of these levels, traders may consider entering a long or short position, depending on the direction of the price movement.
Figure 2: Fibonacci retracements in use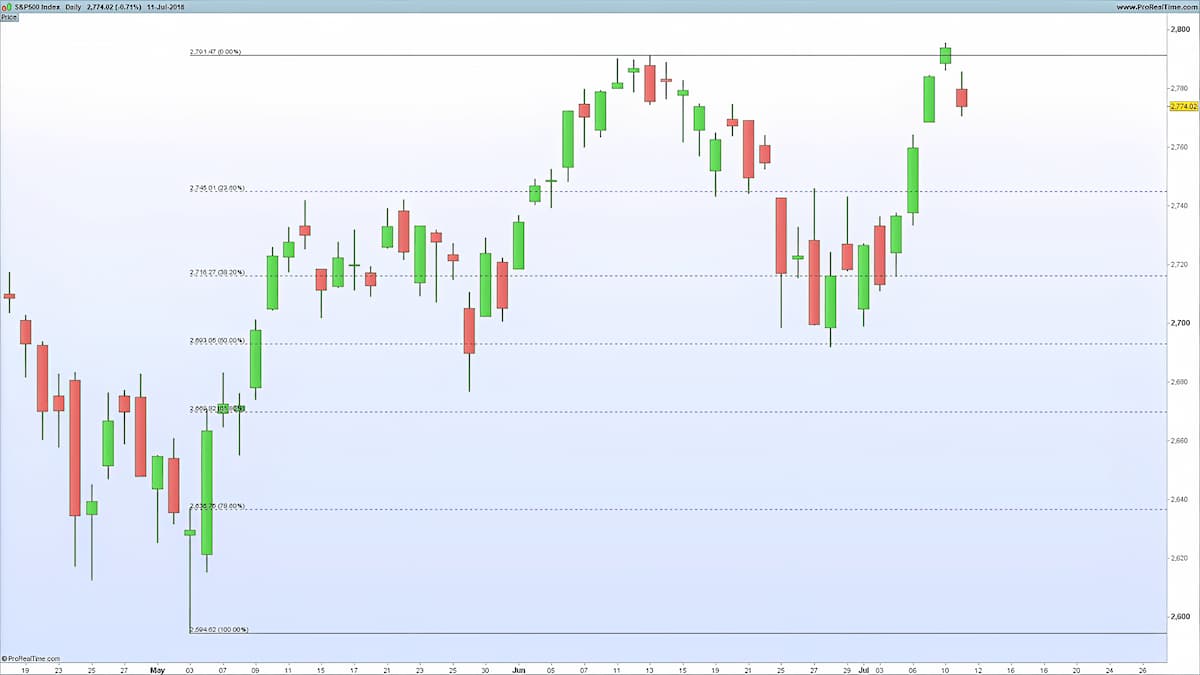
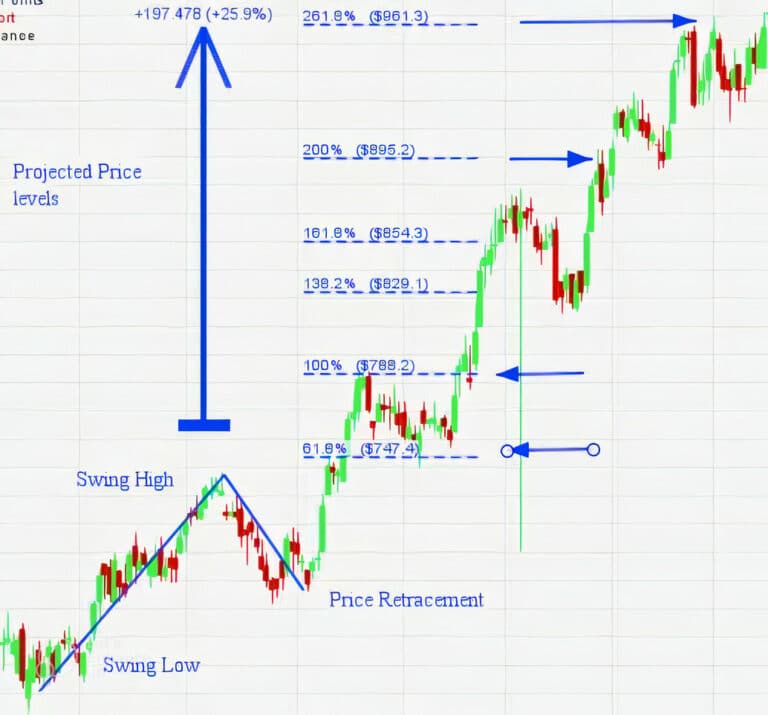
What is Fibonacci Extension?
Fibonacci extensions are technical analysis tools used to identify potential levels of support and resistance levels in financial markets. The extensions are based on the Fibonacci sequence, which is a series of numbers where each number is the sum of the two preceding ones (0, 1, 1, 2, 3, 5, 8, 13, 21, etc.). In technical analysis, the most commonly used Fibonacci levels are 0.0%, 23.6%, 38.2%, 50.0%, 61.8%, and 100.0%.
Here’s an example of how Fibonacci extensions can be used in currency trading:
Let’s say you want to trade XYZ stock. After analyzing the charts, you determine that the stock has recently made a significant move from $100 to $150. You can use Fibonacci extensions to determine where the stock may find support or resistance on its next move.
Plot the Fibonacci extension from the swing low to swing high, which in this case is from $100 to $150.
The 38.2% extension level is calculated by multiplying the difference between the swing high and swing low by 0.382 and then adding the result to the swing low. In this case, that level is $119.1.
The 50.0% extension level is calculated by multiplying the difference between the swing high and swing low by 0.5 and then adding the result to the swing low. In this case, that level is $125.
The 61.8% extension level is calculated by multiplying the difference between the swing high and swing low by 0.618 and then adding the result to the swing low. In this case, that level is $130.9.
If the stock approaches one of these levels, traders may take this as an opportunity to enter a trade, as the stock may find support at the level and bounce back up. However, if the stock breaks through these levels, traders may consider exiting their positions, as this could signal that the stock is losing momentum.
Figure 3: Fibonacci Extension
Section 5 / 14
How to use Fibonacci Retracements in Trading
Here’s how to use Fibonacci retracement in trading.
- Identify the high and low points: Find the significant high and low points of the asset’s price movement.
- Plot the Fibonacci retracement levels: Use a charting tool to plot the Fibonacci retracement levels between the high and low points. The levels are derived from the Fibonacci sequence and include 23.6%, 38.2%, 50%, 61.8%, and 100%.
- Look for potential support and resistance levels: As prices retrace, they may encounter support or resistance at one of the Fibonacci levels.
- Make trading decisions: If prices break through a support or resistance level, traders may look to enter or exit a trade accordingly.
Example using Gold:
Suppose the price of gold had a significant move from $1,500 to $1,800. The low point would be $1,500 and the high point would be $1,800.
After plotting the Fibonacci retracement levels, a trader might observe that the price of gold is finding support at the 50% retracement level, which is near $1,650. The trader might then consider entering a long position in gold, with a stop loss order placed below the 50% Fibonacci level.
Section 6 / 14
Benefits of the Fibonacci Retracement Strategy for Expert Traders
The Fibonacci retracement strategy offers several advantages to expert traders seeking to make informed trading decisions. Here are some key benefits:
1. Identifying Support and Resistance Levels:
The Fibonacci retracement strategy helps traders pinpoint potential support and resistance levels, which are crucial for determining price movements and setting entry and exit points. For example, if a stock is trending upwards and pulls back to a key Fibonacci level, it may signal a potential buying opportunity. This deeper understanding of market structure makes the strategy a valuable tool in a trader’s arsenal.
2. Enhanced Risk Management:
By providing clear entry and exit points, the Fibonacci retracement strategy enhances risk management. Traders can set stop-loss orders at key Fibonacci levels, thereby limiting their risk exposure. For instance, placing a stop-loss below the 78.6% retracement level helps protect capital and can lead to more consistent profits and reduced losses over time.
3. Improved Market Timing:
Fibonacci retracement levels can significantly improve a trader’s market timing by indicating potential reversal points. For example, if a currency pair reaches a 61.8% retracement level, it might signal a trend reversal, providing an opportune moment to enter or exit a position. This can greatly enhance a trader’s decision-making process.
4. Increased Confidence in Trading Decisions:
The Fibonacci retracement strategy can boost traders’ confidence by offering a solid, mathematically based foundation for analysis. For instance, the predictability of the Fibonacci sequence can help traders feel more assured in their forecasts, leading to more accurate trading decisions and improved overall performance.
Section 7 / 14
Practical Application of the Fibonacci Retracement Strategy in Trading
The Fibonacci retracement strategy is versatile and applicable across various financial markets. Here are some practical examples:
1. Stock Market Trading:
In stock trading, Fibonacci levels help identify entry and exit points. For instance, if a stock has surged and then pulls back to a 38.2% retracement level, a trader might see this as a buying opportunity, anticipating a continuation of the uptrend.
2. Forex Trading:
In the forex market, Fibonacci retracement levels can identify potential support and resistance areas. For example, if the EUR/USD pair falls and then retraces to the 50% level, a trader might consider this a potential entry point for a long position, expecting the pair to bounce back.
3. Commodities and Futures Trading:
In commodities and futures trading, such as gold or oil, Fibonacci retracement levels can help determine strategic entry and exit points. For instance, after a significant decline in gold prices, a retracement to the 61.8% level might suggest a buying opportunity.
4. Cryptocurrency Trading:
In the cryptocurrency market, Fibonacci retracement levels can be used to identify potential support and resistance in volatile assets like Bitcoin or Ethereum. For example, if Bitcoin drops and then retraces to the 50% level, traders might see this as a sign to buy, anticipating a rebound.
Section 8 / 14
Hypothetical Example: Fibonacci Retracement Trading Strategy
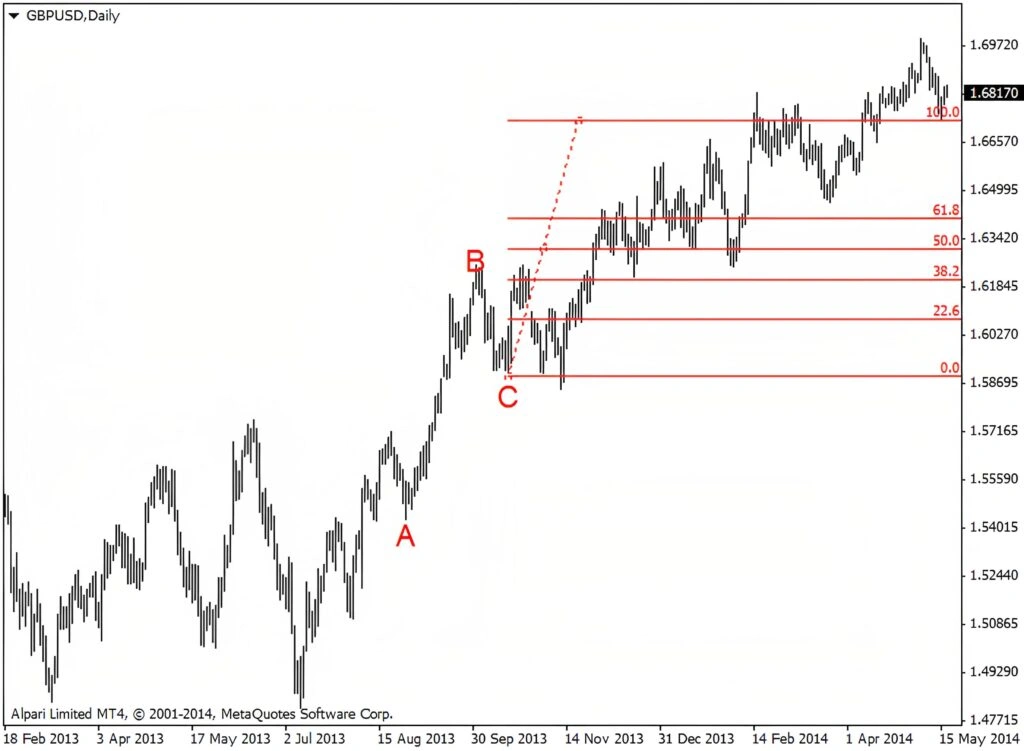
Identify the Trend: Assume an upward trend with higher highs and higher lows.
Select Swing Points: Choose a significant swing low (1.2000) and a swing high (1.2500).
Draw Fibonacci Levels:
- 0%: 1.2500 (recent swing high)
- 23.6%: ~1.2382
- 38.2%: ~1.2309
- 50%: 1.2250
- 61.8%: ~1.2191
- 78.6%: ~1.2118
- 100%: 1.2000 (recent swing low)
Trading Plan:
- Entry Point: Enter a long position around the 61.8% retracement level (1.2191) if a bullish reversal signal is observed.
- Stop Loss: Place the stop loss just below the 78.6% level (1.2118).
- Take Profit Levels:
- Take Profit 1: Set at the 38.2% level (1.2309).
- Take Profit 2: Set at the 0% level (1.2500).
Risk Management:
Risk-Reward Ratio: If entry is at 1.2191 and the stop loss is at 1.2118 (73 pips risk), and Take Profit 1 is at 1.2309 (118 pips reward), the risk-reward ratio is approximately 1:1.6.
Section 9 / 14
How to Incorporate Risk Management with Fibonacci Retracement Levels
Position Sizing: Determine position size based on account balance and risk tolerance. For example, risk no more than 2% of your capital on a single trade.
Stop-Loss Orders: Always set stop-loss orders slightly below significant Fibonacci levels, such as the 78.6% level, to limit potential losses.
Risk-Reward Ratio: Aim for a favourable risk-reward ratio (e.g., 1:2). Adjust take profit levels based on Fibonacci extensions to ensure potential rewards outweigh risks.
Diversification: Spread the risk by diversifying across different assets or currency pairs, avoiding over-concentration in a single trade.
Avoid Emotional Reactions: Stick to your risk management plan and avoid adjusting it based on emotions or short-term market fluctuations. Refrain from revenge trading after losses.
Section 10 / 14
Limitations of the Fibonacci Trading Strategy
Lack of Scientific Basis: The Fibonacci sequence, while mathematically interesting, has no inherent connection to market behavior, making its predictive power uncertain.
Overreliance on Historical Patterns: Fibonacci levels are based on past price movements, which do not always predict future trends accurately.
Subjectivity in Applying Levels: Different traders may apply Fibonacci levels differently, leading to varying interpretations and results.
False Signals: The strategy can generate false signals, leading to unnecessary trades or missed opportunities, particularly for less experienced traders.
Limited Predictive Power: While helpful in identifying support and resistance, Fibonacci levels do not provide insights into market sentiment or future price movements.
Failure to Account for Market Dynamics: The strategy does not consider external factors like news events or economic indicators that can significantly impact market dynamics.
Incompatibility with Other Strategies: The assumptions underlying the Fibonacci strategy may not align with other trading methods, limiting its effectiveness when combined with other strategies.
Overuse and Overtrading: Its simplicity and visual appeal can lead to overuse, resulting in higher transaction costs and reduced profitability due to overtrading.
Section 11 / 14
Fibonacci Projections
Fibonacci projection is a technical analysis tool that uses the Fibonacci sequence to predict potential levels of support and resistance in the future price movement of an asset. The Fibonacci sequence is a series of numbers where each number is the sum of the two preceding numbers, starting with 0 and 1. By plotting these numbers on a chart, traders can identify key levels where the asset price may experience resistance or support.
Fibonacci projections are used by traders in forex, stocks, commodities, and other financial markets to make informed investment decisions. The key levels identified by the Fibonacci projection tool can help traders determine potential entry and exit points, as well as set stop-loss orders.
Investors use Fibonacci projections as a complementary tool along with other technical analysis indicators and fundamental analysis to make informed decisions about their investments. It is important to note that Fibonacci projections are not a guarantee of future market performance, but rather a tool to help traders make informed decisions based on past market behavior.
Overall, Fibonacci projection is a valuable tool for traders and investors looking to gain insight into potential market movements and make informed investment decisions.
Figure 4: Fibonacci Projections
Section 12 / 14
Fibonacci Fan
A Fibonacci fan is a technical analysis tool that uses Fibonacci retracement lines to identify potential levels of support and resistance in an asset’s price action. The tool is created by drawing a trendline between two extreme points and then dividing the vertical distance with the key Fibonacci ratios of 23.6%, 38.2%, 50%, 61.8% and 100%.
These Fibonacci retracement lines can then be used to identify areas where the price may potentially experience support or resistance. If the price action of the asset is trending upwards, the Fibonacci fan can be used to identify potential levels of support. Conversely, if the price action is trending downwards, the Fibonacci fan can be used to identify potential levels of resistance.
Investors and traders use Fibonacci fan as a way to make informed decisions about buying or selling an asset. The tool is particularly useful for those who follow a momentum or trend-following trading strategy, as it can help identify key levels where the trend may reverse or continue. The combination of trend analysis and Fibonacci retracement levels makes the Fibonacci fan a powerful tool for technical analysis.
Figure 5: Fibonacci Fan
Section 13 / 14
Summary
The Fibonacci trading strategy is a technical analysis approach that uses mathematical relationships between successive Fibonacci numbers to identify potential levels of support and resistance in an asset’s price action. This approach is based on the idea that prices tend to retrace a predictable portion of a move, after which they will continue to move in the original direction. The strategy involves identifying key Fibonacci levels, such as the 38.2%, 50%, and 61.8% retracement levels, and using these levels to make trading decisions.
Traders using this strategy will often look for price action to confirm the validity of the Fibonacci levels by looking for price bounces or reversals at these levels. If the price action confirms the levels, traders may enter positions or adjust existing positions accordingly.
Overall, the Fibonacci trading strategy can be a useful tool for traders looking to improve their analysis and make more informed trading decisions. However, like any technical analysis approach, it should be used in conjunction with other analysis methods and should not be relied upon solely for making trading decisions.
Section 14 / 14
Key Takeaways:
- The Fibonacci sequence and the Golden Ratio are mathematical concepts that can be applied to financial markets for technical analysis.
- Traders use Fibonacci retracement levels to identify potential support and resistance levels where an asset’s price may find a floor or ceiling after a significant move up or down.
- Fibonacci extensions can be used to project potential profit targets by applying the Fibonacci ratios to the previous price swing.
- Fibonacci projections help forecast future support and resistance levels by projecting the Fibonacci ratios from a significant price move.
- The Fibonacci fan uses trendlines and Fibonacci ratios to identify potential support and resistance levels in a trending market.
- Traders can use Fibonacci levels to make informed decisions about entering or exiting trades, setting stop-loss orders, and taking profits.
- Fibonacci trading strategies should be used in conjunction with other technical analysis tools and fundamental analysis, and not solely relied upon for making trading decisions.
- The Fibonacci sequence and its ratios are found in many natural phenomena, and their application in financial markets is based on the idea that prices tend to retrace a predictable portion of a move before continuing in the original direction.