
Section 1 / 9
Moving averages are a popular technical analysis tool used by traders and investors to understand the trend direction of a financial asset. A moving average is simply the average price of an asset over a specified period of time. There are two main types of moving averages: simple moving average (SMA) and exponential moving average (EMA).
SMA calculates the average price of an asset over a specific number of periods by adding the closing prices together and dividing by the number of periods. EMA is similar, but it places more weight on recent prices, making it more responsive to changes in the market.
Traders use moving averages to identify trends and determine whether an asset is likely to move up or down. They can also use moving averages to identify potential entry or exit points in the market. By looking at the average price over a certain period of time, traders can get a better understanding of the overall direction of the market and use this information to inform their trading decisions.
Section 2 / 9
Types of Moving averages
There are several types of moving averages, each with its own unique characteristics and uses.
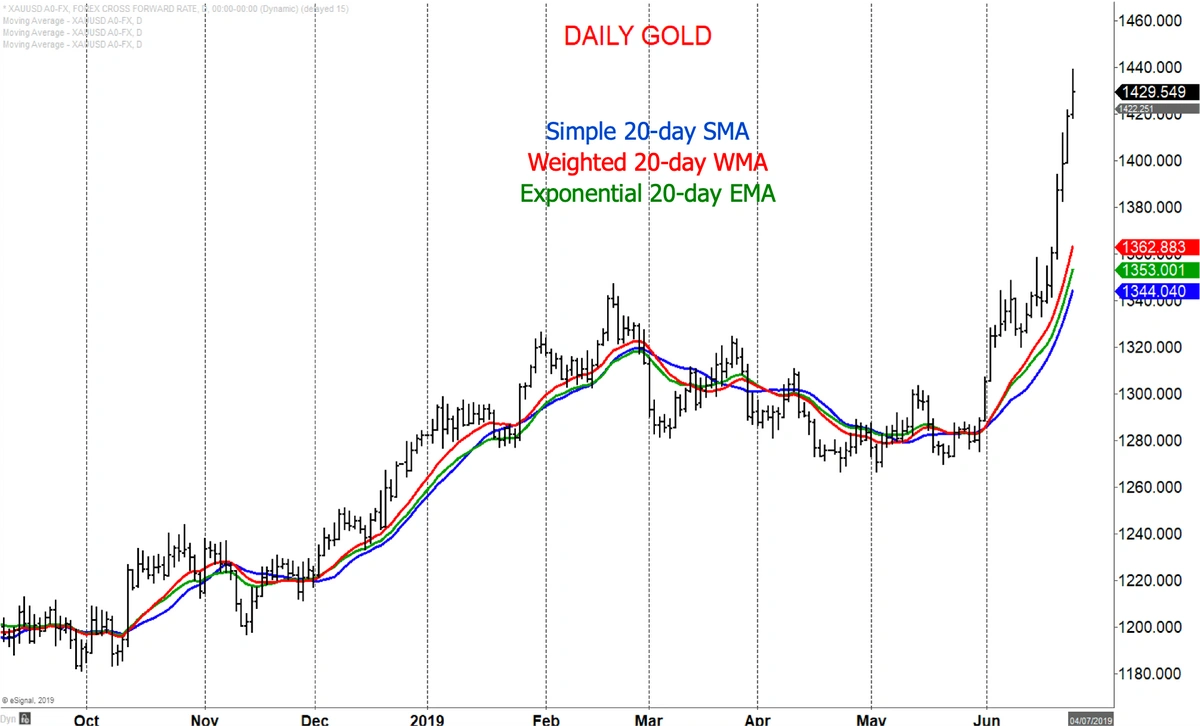
- The simplest type of moving average is the “simple moving average” (SMA). This type of moving average is calculated by taking the average of a specified number of data points, usually the closing prices of an asset. For example, a 10-day SMA is calculated by adding up the closing prices of the past 10 days and dividing by 10. The result is a line that smooths out the price data and helps identify trends over time.
- Another type of moving average is the “exponential moving average” (EMA). This type of moving average is similar to the SMA, but it places greater weight on more recent data points. This means that EMAs are more responsive to changes in price and can help identify trends more quickly than SMAs. The formula for calculating an EMA involves using a multiplier that increases exponentially with each new data point.
- The “exponential weighted moving average” (EWMA) is a variation of the EMA that place even greater weight on the most recent data points. This makes EWMA even more responsive to changes in price than the EMA.
Moving averages can also be used as indicators to help traders identify buy and sell signals. For example, when a short-term moving average crosses above a long-term moving average, it may indicate a bullish trend and a potential buying opportunity. Conversely, when a short-term moving average crosses below a long-term moving average, it may indicate a bearish trend and a potential selling opportunity. This type of moving average indicator is commonly used in technical analysis.
Section 3 / 9
Simple moving average vs Exponential moving average:
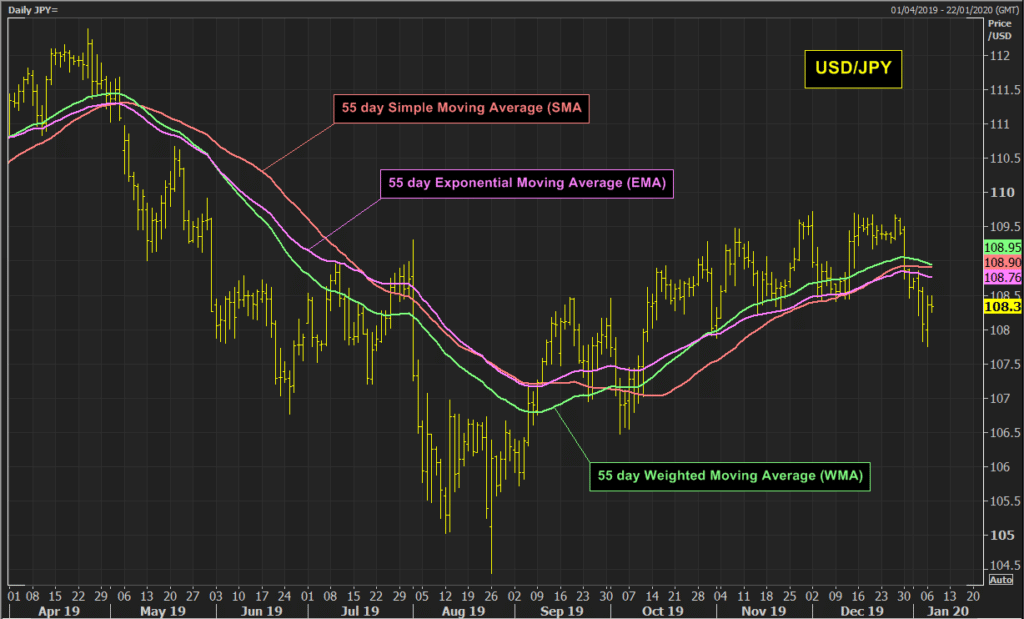
- Simple Moving Averages (SMA) and Exponential Moving Averages (EMA) are both commonly used as technical indicators in financial markets to analyze price trends.
- Both SMA and EMA are calculated by taking the average of the closing price over a specific time period.
- SMA calculates the average price over a fixed time period, while EMA gives more weight to recent prices.
- The time period used for calculating SMA and EMA can vary based on the trader’s preference and the trading strategy being employed.
- Both SMA and EMA are used to identify support and resistance levels, where support represents the level at which the price tends to stop falling, and resistance represents the level at which the price tends to stop rising.
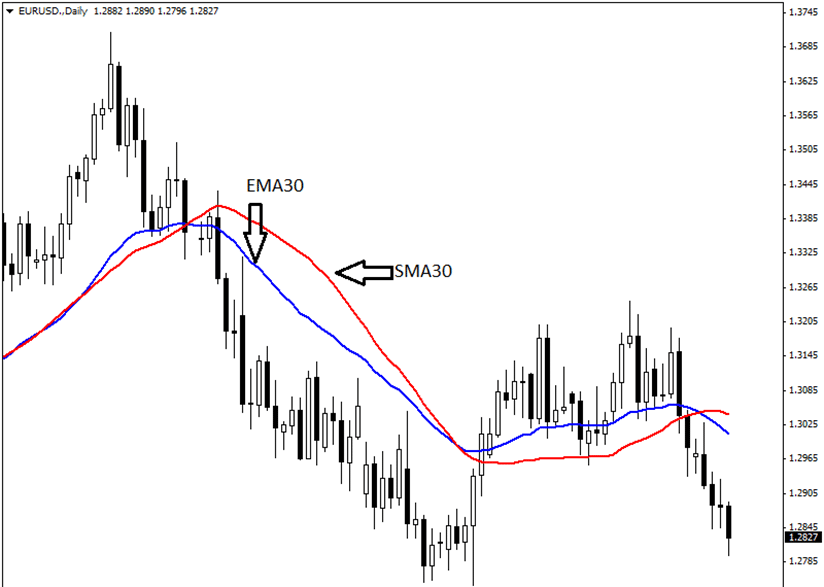
- Moving Average Crossover is a popular trading strategy that uses both SMA and EMA to generate trend reversals. When the shorter-term EMA crosses above the longer-term SMA, it can be an indication to buy, and when the EMA crosses below the SMA, it can be a signal to sell.
- EMA is considered to be more sensitive to price changes than SMA, which means it may give more accurate and timely signals for trend reversals.
- while both SMA and EMA are useful technical indicators for analyzing price trends, EMA may be more suitable for traders who need to react quickly to changes in the market, while SMA may be more appropriate for traders who prefer to take a longer-term view of price movements.
Section 4 / 9
Moving Average Calculations
To calculate a moving average, you need to first determine a time period, which can be any length depending on your preference or trading strategy. For example, a 10-day moving average would average the prices of the past 10 days, while a 50-day moving average would average the prices of the past 50 days.
Let’s say we want to calculate a 10-day moving average of the exchange rate between the US dollar (USD) and the Euro (EUR). Here’s how we can do it:
- First, gather the exchange rate data for the past 10 days. For example, let’s assume the exchange rates for the past 10 days are:
- Day 1: 0.85 EUR/USD
- Day 2: 0.84 EUR/USD
- Day 3: 0.83 EUR/USD
- Day 4: 0.82 EUR/USD
- Day 5: 0.81 EUR/USD
- Day 6: 0.80 EUR/USD
- Day 7: 0.79 EUR/USD
- Day 8: 0.78 EUR/USD
- Day 9: 0.77 EUR/USD
- Day 10: 0.76 EUR/USD
- Next, add up the exchange rates for the past 10 days:
0.85 + 0.84 + 0.83 + 0.82 + 0.81 + 0.80 + 0.79 + 0.78 + 0.77 + 0.76 = 8.05
- Then, divide the sum by the number of days in the time period (which is 10 in this case):
8.05 / 10 = 0.805
- The resulting value of 0.805 is the 10-day moving average of the EUR/USD exchange rate.
Moving averages are useful because they smooth out short-term fluctuations in price, which can make it easier to identify the underlying trend. They are often used in conjunction with other technical analysis tools to make trading decisions.
Section 5 / 9
Interpreting Moving Averages
Trend Identification:
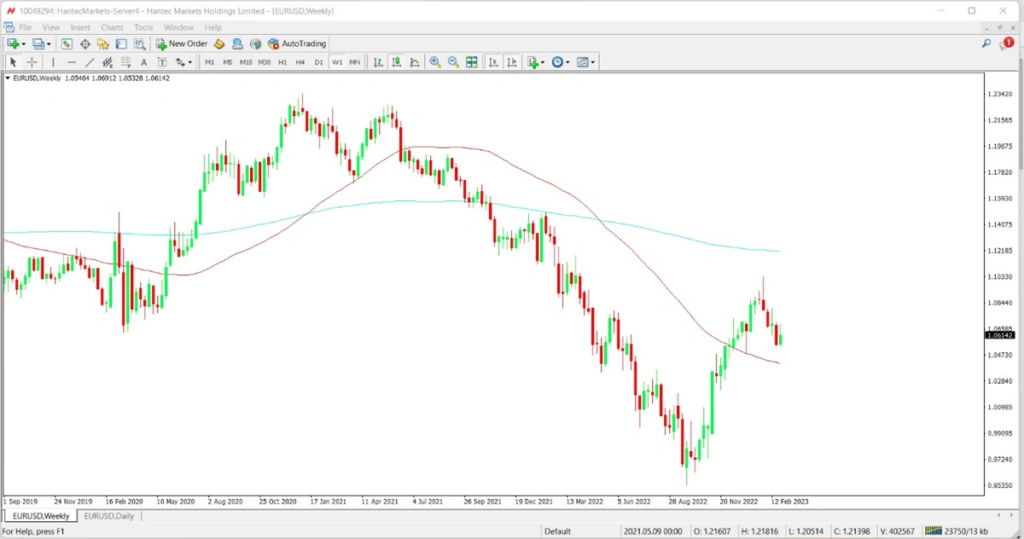
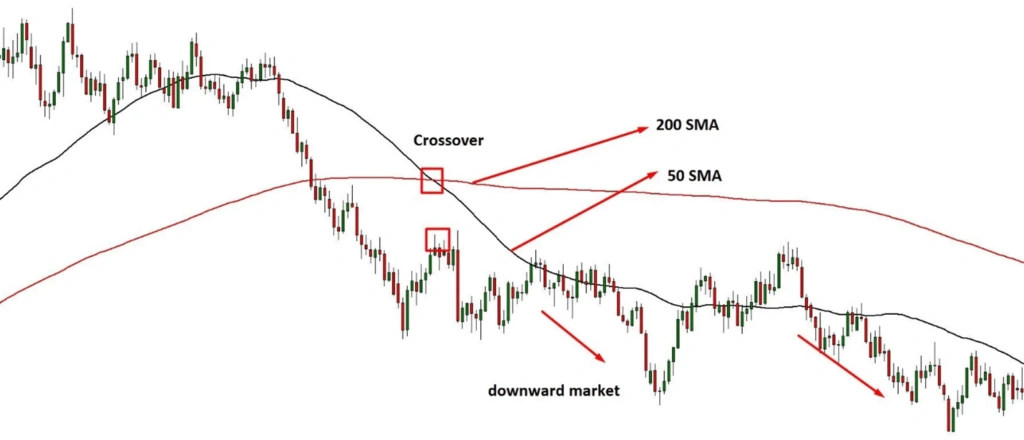
To identify a trend using moving averages, traders often look for the crossover of two moving averages, such as the 50-day moving average and the 200-day moving average. When the shorter-term moving average crosses above the longer-term moving average, it can be a signal of an uptrend, and when the shorter-term moving average crosses below the longer-term moving average, it can be a signal of a downtrend.
Let’s take an example of the EUR/USD currency pair. Suppose a trader is analyzing the daily chart of the EUR/USD and has added a 50-day and 200-day moving average to the chart. If the 50-day moving average crosses above the 200-day moving average, it can indicate an uptrend in the EUR/USD.
The trader can then use this information to plan their trades accordingly. For example, they may look for buying opportunities during pullbacks within the uptrend or wait for a break of a resistance level before entering a long position.
On the other hand, if the 50-day moving average crosses below the 200-day moving average, it can indicate a downtrend in the EUR/USD. The trader may then look for selling opportunities during rallies within the downtrend or wait for a break of a support level before entering a short position.
Section 6 / 9
Double Crossovers
Moving Average Double Crossover is a popular trading strategy used by traders to identify potential buy or sell signals. It is a technical analysis tool that uses two moving averages to identify changes in momentum and trend direction.
The two moving averages used in this strategy are the shorter-term moving average and the longer-term moving average. The shorter-term moving average is typically faster and more responsive to recent price changes, while the longer-term moving average is slower and more stable.
The basic idea of the Moving Average Double Crossover strategy is to buy when the shorter-term moving average crosses above the longer-term moving average and to sell when the shorter-term moving average crosses below the longer-term moving average. This crossover of the two moving averages is a signal that the momentum of the market is changing, and a new trend may be emerging.
Traders often use the 50-day and 200-day moving averages for this strategy, but other combinations of moving averages can also be used depending on the trader’s preference and the market conditions.
One common approach to this strategy is to wait for the crossover to occur and then enter a trade in the direction of the new trend. For example, if the shorter-term moving average crosses above the longer-term moving average, the trader may enter a long position, expecting the price to continue to rise. Similarly, if the shorter-term moving average crosses below the longer-term moving average, the trader may enter a short position, expecting the price to continue to fall.
It is important to note that this strategy is not foolproof and can generate false signals, particularly in choppy or sideways markets. Traders should use additional technical analysis tools and fundamental analysis to confirm the signals generated by the Moving Average Double Crossover strategy.
Section 7 / 9
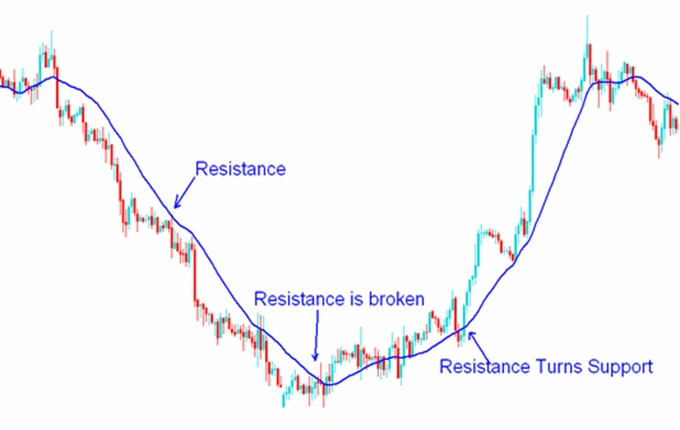
Support and Resistance
Moving averages are a widely used technical indicator in the financial market for identifying support and resistance levels. Traders use different types of moving averages, such as simple moving average (SMA) and exponential moving average (EMA), to analyze price trends and generate trading signals. However, in recent years, the exponentially weighted moving average (EWMA) has gained popularity due to its ability to capture recent price movements more efficiently.
The EWMA is a type of moving average that assigns more weight to the most recent data points and gradually decreases the weight of older data points. This approach allows traders generating multiple trend reversals and identify potential support and resistance levels more accurately.
When using the EWMA to identify support and resistance levels, traders typically look for instances where the price of an asset crosses above or below the moving average line. If the price crosses above the moving average, it could signal a bullish trend, and if the price crosses below the moving average, it could signal a bearish trend.
Additionally, traders can use the slope of the EWMA to determine the strength of the trend. A steep slope indicates a strong trend, while a flat slope indicates a weak trend. By analyzing the slope of the EWMA, traders can identify potential support and resistance levels and adjust their trading strategies accordingly.
Section 8 / 9
Advantages of Using Moving Averages
Here are some of the advantages of using moving averages in forex trading:
- Identify trends: Moving averages help traders to identify the direction of the trend in the forex market. By calculating the average price of a currency over a specific period of time, traders can see whether the currency is trending up, down, or moving sideways.
- Smooth out volatility: Forex markets are known for their volatility, and prices can fluctuate wildly in short periods of time. Moving averages help to smooth out these fluctuations by calculating an average price over a longer period of time, making it easier to identify the overall trend.
- Provide support and resistance levels: Moving averages can also act as support and resistance levels in forex trading. Traders often use moving averages to determine where to place stop-loss orders or where to take profit.
- Help with trade entries and exits: Moving averages can be used to determine the best time to enter or exit a trade. When the price of a currency crosses above or below a moving average, it can be a signal to enter or exit a trade.
- Easy to use: Moving averages are simple and easy to use, making them a popular tool for both novice and experienced traders. They can be applied to any currency pair and any time frame, making them versatile and flexible.
Section 9 / 9
Disadvantages of Using Moving Averages
There are several disadvantages of using moving averages in trading. Here are a few key ones:
- Delayed signals: Moving averages are based on past price data, so they can lag behind current market conditions. This means that by the time a moving average signals a trade entry or exit, it may be too late to take advantage of the opportunity or avoid a loss.
- False signals: Moving averages can produce false signals, particularly during periods of market volatility or choppy price action. This can lead traders to enter or exit trades at the wrong time, resulting in losses.
- Lack of precision: Moving averages are typically calculated using a fixed period of time, such as 20 days or 50 days. This can lead to a lack of precision when it comes to timing trades. For example, a 50-day moving average may be too slow to capture short-term trends, while a 10-day moving average may be too fast to filter out noise.
- Limited information: Moving averages are based solely on price data, so they do not take into account other market factors that may influence price movements. This can limit their effectiveness in predicting future price action.
- Over-reliance: Some traders rely too heavily on moving averages, using them as the sole indicator for making trading decisions. This can lead to a lack of flexibility and an inability to adapt to changing market conditions. It’s important to use multiple indicators and analysis techniques to confirm signals and reduce the risk of false signals.