CFDs are complex instruments and come with a high risk of losing money rapidly due to leverage. 66% of retail investor accounts lose money when trading CFDs with this provider.

You should consider whether you understand how CFDs work and whether you can afford to take the high risk of losing your money.

Please be advised that our Client Portal is scheduled for essential maintenance this weekend from market close Friday 16th February, 2024, and should be back up and running before markets open on Sunday 18th February, 2024.

We’re excited to share that we’re gearing up for an update to our Client Portal, aimed at improving your experience with us. Client Portal will be unavailable to you from market close on Friday 16th February, 2024, and should be back up and running before markets open on Sunday 18th February, 2024.

CFDs are complex instruments and come with a high risk of losing money rapidly due to leverage. 66% of retail investor accounts lose money when trading CFDs with this provider.

You should consider whether you understand how CFDs work and whether you can afford to take the high risk of losing your money.

Search
Close this search box.

Support & Resistance

Trend recognition is vital to any successful trading strategy. Let's take a closer look at how traders can profit from trending markets, know when a new trend is underway, and identify indicators that a trend is ending.

Written by Aaron Akwu, Head of Education Hantec Markets

Table of Contents
    Add a header to begin generating the table of contents

    What is "Support and Resistance Lines"?

    When it comes to trading in the foreign exchange (forex) market, technical analysis plays a crucial role in helping traders make informed decisions. One of the key concepts in technical analysis is support and resistance.

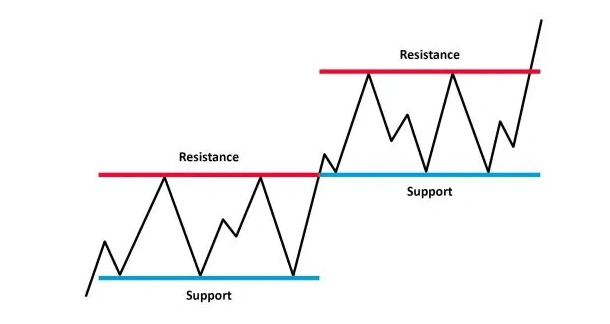
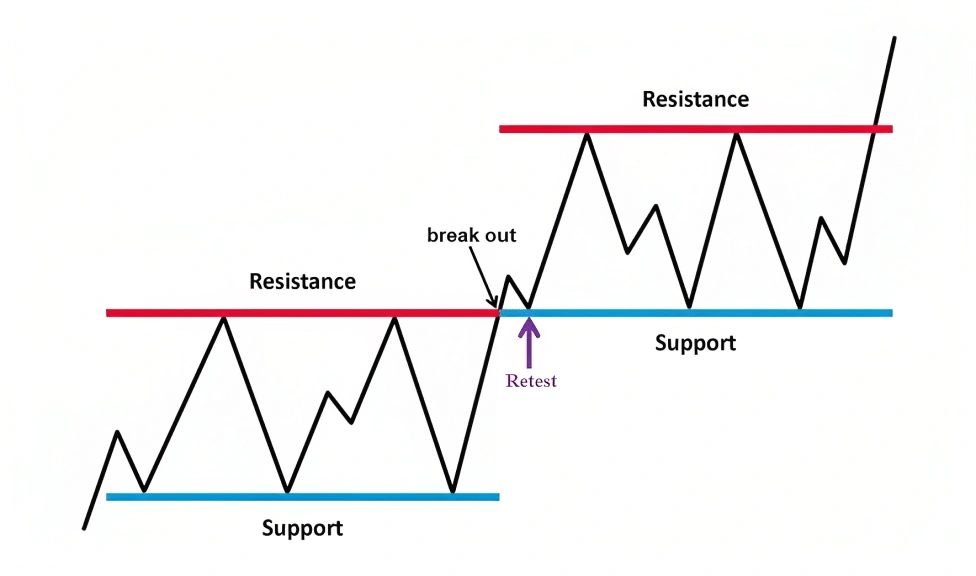
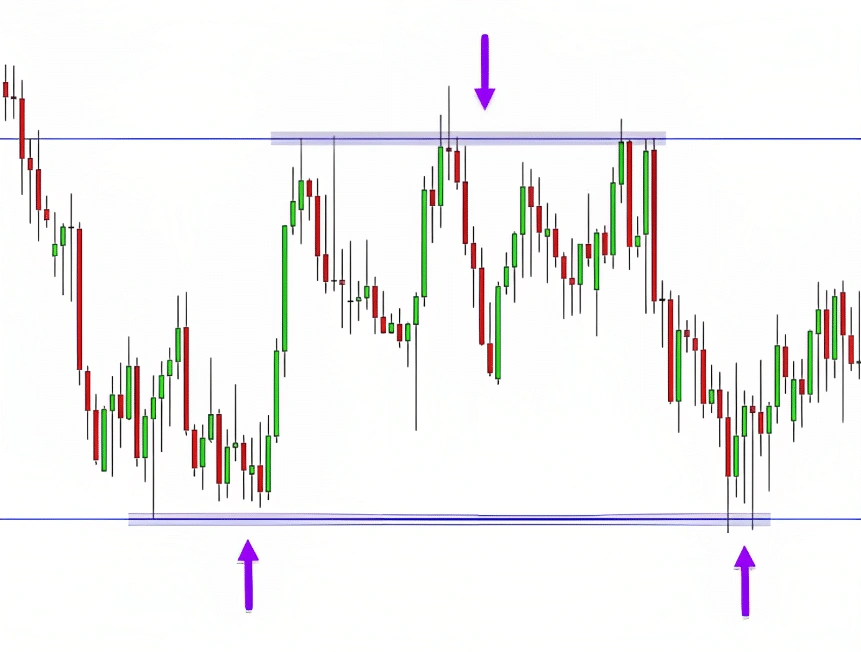
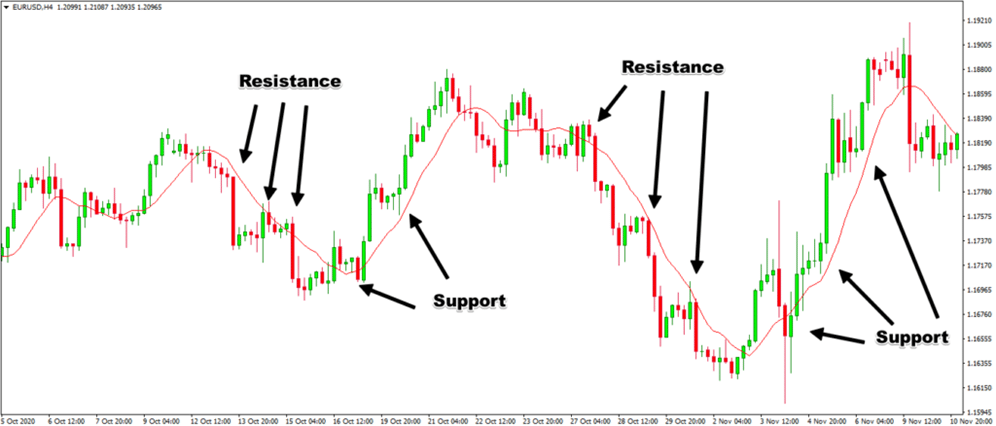
    Support and resistance levels refer to price levels at which the market has previously struggled to break through. A support level is a price level at which the market has historically found buying pressure, which prevents the price from falling further. On the other hand, a resistance level is a price level at which the market has historically found selling pressure, which prevents the price from rising further.

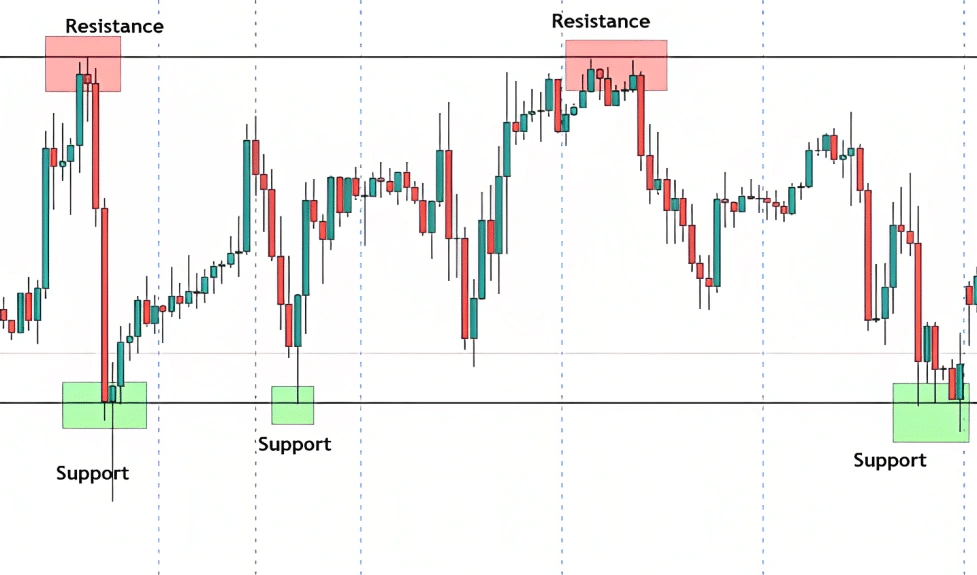
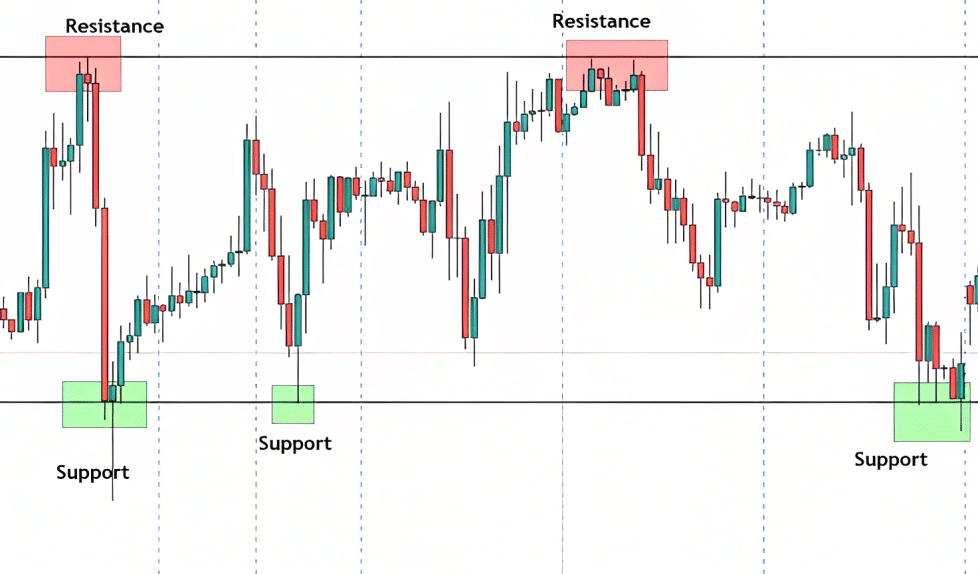
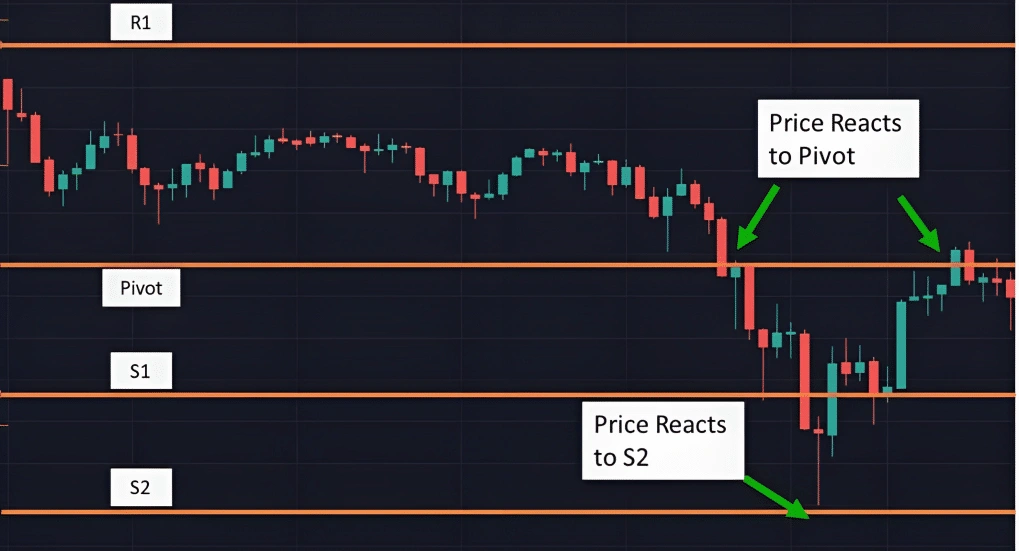
    In technical analysis, traders use various tools and techniques to identify support and resistance levels. One common method is to look for areas on a price chart where the price has previously bounced off or stalled at a certain level. Once these levels are identified, traders will use them as a reference point for future price action.

    Another important concept in support and resistance is the resistance line. This is a trendline drawn on a price chart that connects two or more resistance levels. The resistance line serves as a visual reference for traders to identify areas where the price may struggle to break through.

    Similarly, traders also draw support lines which connect two or more support levels. These lines can help traders identify areas where the price may find buying support, and thus, may be less likely to fall below that level.

    It’s important to note that support and resistance levels are not set in stone and can change over time. As the market evolves, price breaks through these levels, and new support and resistance levels are established.

    Plotting support and resistance levels

    Plotting support and resistance levels is an important aspect of technical analysis in the financial market. Understanding these levels can help traders make informed decisions about buying or selling a stock.

    To plot support and resistance levels, you need to start by identifying key price points on a chart. Resistance lines are drawn across the chart at price points where the price has encountered resistance in the past, while support lines are drawn at price points where the price has found support in the past. These lines should be drawn as straight as possible across the chart to show the levels where the price is likely to find support or resistance.

    Once you have identified these key price points and drawn the lines, you can start to identify support and resistance zones. A support zone is the area on the chart where the price is likely to find support, while a resistance zone is the area where the price is likely to encounter resistance. These zones are usually drawn as rectangles or boxes, covering the range between the support and resistance lines.

    When plotting support and resistance levels, it is important to keep in mind that these levels are not fixed and can change over time. Traders should regularly update their charts and adjust their support and resistance lines to reflect changes in the market. They should also be aware that support and resistance levels can be broken, leading to a significant shift in the currency or stock price.

    support and resistance plotting

    How to determine strong support and resistance levels:

    These levels are determined by market participants’ actions and reactions to price movements over time. Here’s how you can determine strong support and resistance levels:

    Firstly, you need to identify the trading range of the asset. The trading range is the range within which the price of an asset has been fluctuating within a given period. To identify the trading range, you need to look at the highs and lows of the price movements within a specific time frame.

    Once you have identified the trading range, you can start identifying the support and resistance levels. A support level is a price level where the price falls but then bounces back up. On the other hand, a resistance level is a price level where the price reaches but then drops back down.

    To determine strong support and resistance levels, you need to look for price levels where there have been multiple bounces or drops. The more times the price has bounced off a particular level, the stronger the support or resistance level is likely to be.

    You can also use other technical analysis tools such as trend lines, moving averages, and Fibonacci retracements to confirm the strength of the support or resistance level. For instance, if a trendline intersects with a support or resistance level, it can confirm the strength of that level.

    support and resistance - strong

    How to know if support and resistance lines are broken:

    To know if support and resistance lines are broken, we need to pay close attention to the price movements. First, we need to identify the support or resistance line by looking for a level where the price has bounced off multiple times. Once we have identified the level, we need to look for signs that it has been broken.

    One indication that a support or resistance level has been broken is when the price moves beyond it. For example, if a support level is at $50, and the price drops below $50, then the support level has been broken. Similarly, if a resistance level is at $100, and the price breaks through $100, then the resistance level has been broken.

    However, it’s important to note that identifying support and resistance levels and determining whether they have been broken is not an exact science. Sometimes the price may test a support or resistance level several times before finally breaking through it. In these cases, we need to look for a clear break, where the price moves decisively beyond the level.

    Trading Ranges

    Trading ranges in forex refer to a period of time when the price of a currency pair moves within a relatively narrow range. During a trading range, the price bounces back and forth between a certain support level and a certain resistance level, without breaking out of that range. This type of price action can be frustrating for traders who are looking for big moves in the market, but it can also present opportunities for those who are patient and know how to trade within the range.

    When a currency pair is in a trading range, traders will typically look to buy at the support level and sell at the resistance level. This is because they expect the price to continue bouncing between those two levels, without breaking out. Traders may also use technical analysis tools, such as moving averages and trend lines, to identify potential entry and exit points within the range.

    One of the key challenges of trading within a range is that it can be difficult to predict when the range will end, and the price will break out. Traders must be prepared to adjust their strategies if the price suddenly breaks through the support or resistance levels. This is why it is important to set stop-loss orders and take-profit orders to manage risk and lock in profits.

    Trading ranges can last for varying lengths of time, from a few hours to several weeks or even months. The longer the range persists, the greater the potential for a breakout.

    What are the best indicators for support and resistance?

    Here are some of the best indicators for identifying support and resistance levels in the forex market:

    Moving averages are widely used by traders to identify the direction of the trend. They can also be used to identify key levels of support and resistance. For example, if the price is above the 200-day moving average, it may be considered a support level, while if it is below the 200-day moving average, it may be considered a resistance level. 

    The Fibonacci retracement tool is based on the idea that markets will often retrace a predictable portion of a move, after which they will continue in the original direction. This tool identifies key levels of support and resistance by drawing horizontal lines at the key Fibonacci retracement levels of 23.6%, 38.2%, 50%, 61.8% and 100%.

    support and resitance indicators - Fibonacci Retracement

    Pivot points are based on the high, low, and closing prices of the previous trading session. They are calculated to identify key levels of support and resistance for the current trading session. Pivot points are especially useful for short-term traders who are looking to enter and exit positions quickly.

    support and resitance indicators - pivot points

    Bollinger Bands are a technical analysis tool that uses a moving average and two standard deviations to identify key levels of support and resistance. The upper and lower bands are often used as dynamic support and resistance levels, where the price is expected to bounce back in the opposite direction.

    Volume is a key indicator of market activity and can be used to identify key levels of support and resistance. High volume at a particular price level may indicate that it is a key level of support or resistance, as traders are more likely to enter or exit positions at that level.

    Related Articles
    rotator.png

    We are transferring you to our affiliated company Hantec Trader.

    Please note: Hantec Trader does not accept customers from the USA or other restricted countries.

    Line-website.png