Một trong những khái niệm quan trọng nhất trong giao dịch và phân tích kỹ thuật là xác định mức hỗ trợ và mức kháng
Please be advised that our Client Portal is scheduled for essential maintenance this weekend from market close on Friday 5th April, 2024, and should be back up and running before markets open on Sunday 7th April, 2024.
Chúng tôi rất vui mừng được chia sẻ rằng chúng tôi đang chuẩn bị cập nhật Cổng thông tin khách hàng nhằm mục đích cải thiện trải nghiệm của bạn với chúng tôi. Cổng thông tin khách hàng sẽ không khả dụng cho bạn kể từ khi thị trường đóng cửa vào thứ Sáu ngày 16 tháng 2 năm 2024 và sẽ hoạt động trở lại trước khi thị trường mở cửa vào Chủ nhật ngày 18 tháng 2 năm 2024.
CFDs are complex instruments and come with a high risk of losing money rapidly due to leverage. 61% of retail investor accounts lose money when trading CFDs with this provider.
You should consider whether you understand how CFDs work and whether you can afford to take the high risk of losing your money.
The battle between buyers (demand) and sellers (supply) is the key to price movements. In technical analysis, it creates what we see as resistance and support levels.
When the price of an instrument reaches a level where supply overtakes demand, a rise in price will hit the ceiling and begin to fall. A high in the price is left, and resistance is created.
When an instrument sees demand become greater than supply, this creates a floor in the price, and it will begin to rise. A low is produced, and support is formed.
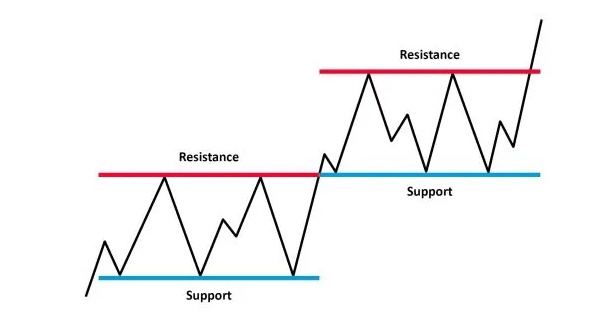
Figure 1: Support and Resistance
As you can see in the above illustration, the lows in price act as support, while the highs indicate resistance. Support shows the levels at which traders are willing to buy, while resistances are the levels at which traders are looking to sell.
These support and resistance levels are significant in terms of market psychology and are the graphical illustration of supply and demand.
In the illustration above, you can also see a break above resistance which then becomes a new level of support.
Once these levels have been broken, supply and demand and the psychology behind the price movement will both be thought to have shifted. Subsequently, new levels of support and resistance will be established. In this way, once a resistance or support level is broken, its role often becomes reversed.
If the price falls below a support level, that level will become a basis of resistance. If the price rises above a resistance level, it will become a basis of support.
For a true reversal to occur, it is important that the price makes a strong move through either the support or resistance.
Often there can be a pullback to the break level, before continuing in the direction of the break.

Figure 2: Old support becomes new resistance, and vice versa
Analysis of support and resistance is an important part of trend analysis that you can use to inform trading decisions and identify when a trend could be reversing.
For example, if you’re looking to trade long, you can try to identify where important support levels are holding and use them as entry points for trades. Furthermore, if you then identify a level of resistance that has been tested several times but never broken, you might decide to close the position as the price moves toward this level again.
The assessment would be that the market is finding it difficult to breach the resistance, and with upside being limited, the probability of another move back lower is elevated. Traders often use key support levels as a basis for their stop-losses on long positions.
If you’re trading short, you could look at key resistance levels as entry points, and support for potential targets/profit-triggers.
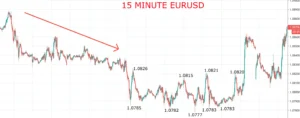
On the chart of USD/JPY shown above, throughout Q2 2019 into Q3, old support levels became the basis of resistance as rallies failed at lower levels, and were sold into. However, market sentiment shifted in September 2019 and this would have resulted in short positions being stopped out.
Một trong những khái niệm quan trọng nhất trong giao dịch và phân tích kỹ thuật là xác định mức hỗ trợ và mức kháng
Thị trường không phải lúc nào cũng biến động theo một hướng, có khi nó đổi hướng rồi lại bắt đầu xu hướng theo hướng


Risk Warning
CFDs are complex instruments and come with a high risk of losing money rapidly due to leverage.
61% of retail investor accounts lose money when trading CFDs with this provider.
You should consider whether you understand how CFDs work and whether you can afford to take the high risk of losing your money.
Please click here to view our Risk Disclosure.
Hantec Markets use cookies to enhance your experience on our website. By staying on our website you agree to our use of cookies.
You can access our Cookie Policy here
Risk Warning
CFDs are complex instruments and come with a high risk of losing money rapidly due to leverage.
You should consider whether you understand how CFDs work and whether you can afford to take the high risk of losing your money.
Please click here to view our Risk Disclosure.
Hantec Markets use cookies to enhance your experience on our website. By staying on our website you agree to our use of cookies. You can access our Cookie Policy here
Hantec Markets là công ty giao dịch trực thuộc của Tập đoàn Hantec.
Trang web này được sở hữu và điều hành bởi Hantec Markets Holdings Limited. Hantec Markets Holdings Limited là công ty cổ phần của Hantec Markets Limited, Hantec Markets Ltd.
Hantec Markets Limited được ủy quyền và quản lý bởi Cơ quan Quản lý Tài chính (FCA) tại Vương quốc Anh (Số đăng ký: FRN 502635).
Hantec Markets Ltd. được Ủy ban Dịch vụ Tài chính của Mauritius ủy quyền và quản lý với tư cách là Đại lý Đầu tư (Giấy phép số: C114013940).
Các dịch vụ của Hantec Markets và thông tin trên trang web này không đề cập đến cư dân của các tỉnh thành phố nhất định, và không dành cho phân phối hoặc sử dụng bởi bất kỳ cá nhân hoặc tổ chức tại bất kỳ tỉnh thành phố hoặc quốc gia nào, việc phân phối hoặc sử dụng có thể trái với bất kỳ luật hoặc quy định nào của tỉnh thành phố đó.Các sản phẩm và dịch vụ được mô tả trong đây có thể không có sẵn tại tất cả các quốc gia và tỉnh thành phố. Những người truy cập trang web này làm vậy tự nguyện và do đó chịu trách nhiệm tuân thủ các luật và quy định địa phương. Bản phát hành này không tạo thành bất kỳ lời mời hoặc tuyển dụng kinh doanh nào.
Hantec Markets không cung cấp dịch vụ cho cư dân của một số địa phương bao gồm Mỹ, Iran, Myanmar, Các Tiểu Vương quốc Ả Rập Thống nhất và Bắc Triều Tiên.
Lorem ipsum dolor sit amet, consectetur adipiscing elit. Ut elit tellus, luctus nec ullamcorper mattis, pulvinar dapibus leo.
Lorem ipsum dolor sit amet, consectetur adipiscing elit. Ut elit tellus, luctus nec ullamcorper mattis, pulvinar dapibus leo.
Lorem ipsum dolor sit amet, consectetur adipiscing elit. Ut elit tellus, luctus nec ullamcorper mattis, pulvinar dapibus leo.

We are transferring you to our affiliated company Hantec Trader.
Please note: Hantec Trader does not accept customers from the USA or other restricted countries.