
Section 1 / 12
Bollinger Bands were invented by John Bollinger in the early 1980s. Bollinger, a well-known technical analyst, developed the bands as a volatility indicator for stock prices. The bands are plotted two standard deviations away from a simple moving average and can be used to determine overbought and oversold levels in the market. Bollinger Bands have since become a widely used tool in technical analysis and are applied to various financial markets, including equities, bonds, and commodities.

Section 2 / 12
What are Bollinger Bands?
Bollinger Bands are a technical analysis tool consisting of a set of lines plotted two standard deviations away from a simple moving average of a financial instrument’s price, usually the closing price. The basic idea behind Bollinger Bands is to measure and quantify the volatility of a stock or other financial instrument, which can provide traders and investors with valuable information about the asset’s price movements and future trends.
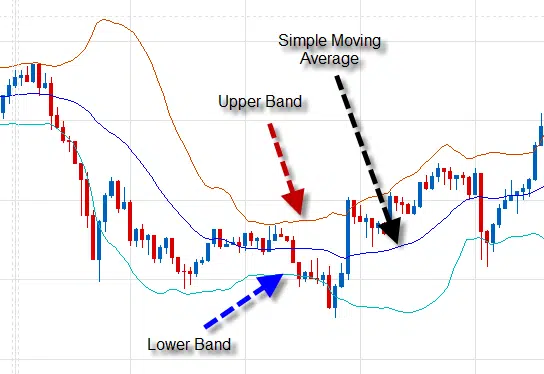
In the basics, Bollinger Bands consist of a middle line (the simple moving average), and two outer lines, the upper and lower bands, each plotted two standard deviations away from it. The width of the bands varies as the volatility of the asset changes, and if the asset’s price breaches one of the outer lines, it can indicate an overbought or oversold condition, which can be used to identify potential entry and exit points for trades. Additionally, Bollinger Bands can be used in conjunction with other technical indicators, such as moving averages and relative strength index (RSI), to confirm trading signals.
Section 3 / 12
Which parameters should be used?
Bollinger Bands are a popular technical analysis tool that uses a simple moving average (SMA) and two standard deviations (SD) to calculate the upper and lower bands.
The “upper band” is calculated by adding two times the standard deviation to the SMA. The “lower band” is calculated by subtracting two times the standard deviation from the SMA. These bands provide an indication of the volatility of a security and are used to identify potential overbought or oversold conditions.
The parameters used in Bollinger Bands include:
SMA (Simple Moving Average): It is the average price of the security over a specified number of periods.
SD (Standard Deviation): It is a measure of the volatility or dispersion of the security’s price.
Time Period: It is the number of periods used in the calculation of the SMA and SD.
Multiplier: It is the number of standard deviations used to calculate the upper and lower bands. The default value is 2, but it can be adjusted to suit the needs of the trader.
Section 4 / 12
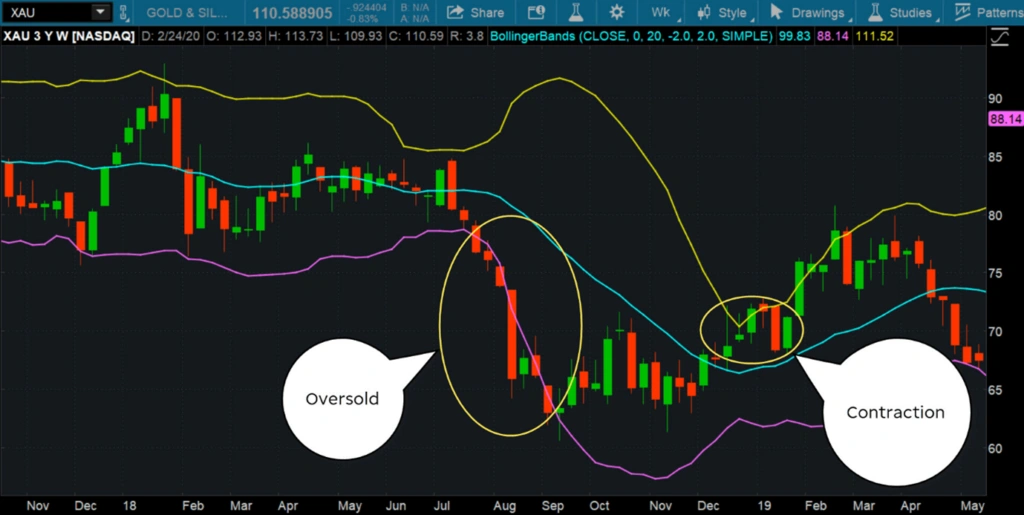
Interpreting Bollinger Bands
The two standard deviations are plotted away from a simple moving average and consist of an upper and lower band. When the market is volatile, the bands expand, and during less volatile periods, they contract. Interpreting Bollinger Bands can give traders and investors a better understanding of potential market movements.
When the price of an asset is trading near the upper Bollinger Band, it is considered overbought and may indicate that the price is likely to fall. Conversely, when the price is trading near the lower Bollinger Band, it is considered oversold and may indicate that the price is likely to rise. This can provide traders with valuable information on potential trade entries and exits.
Section 5 / 12
How to trade using Bollinger bands
Trade examples using Bollinger bands.
Here are two trade examples using Bollinger Bands with USD/JPY:
Bollinger Bands squeeze: When the USD/JPY price moves within narrow Bollinger Bands, it signals a potential price breakout. A trader could go long on the pair if the price breaks above the upper Bollinger Band, or short if the price breaks below the lower Bollinger Band.
Bollinger Bands reversion to the mean: If the USD/JPY price moves outside the Bollinger Bands, it may indicate a potential reversal to the mean or middle Bollinger Band. A trader could go long if the price is below the lower Bollinger Band and crosses above the mean, or short if the price is above the upper Bollinger Band and crosses below the mean.
Example 1: Bollinger Bands squeeze
USD/JPY price: 109.00
Upper Bollinger Band: 109.50
Lower Bollinger Band: 108.50
Moving average: 109.00
A trader could go long on USD/JPY at 109.00 with a target of 109.50 (upper Bollinger Band) and a stop loss of 108.50 (lower Bollinger Band).
Example 2: Bollinger Bands reversion to the mean
USD/JPY price: 110.00
Upper Bollinger Band: 111.00
Lower Bollinger Band: 108.00
Moving average: 109.50
A trader could go short on USD/JPY at 110.00 with a target of 109.50 (moving average) and a stop loss of 111.00 (upper Bollinger Band).
Note that Bollinger band strategy can be used with price action and other technical indicators.
Section 6 / 12
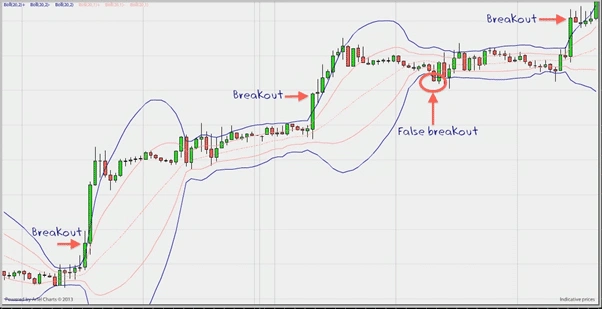
Trading breakout strategy using Bollinger bands
The Bollinger Band Breakout strategy is a popular trading technique that uses Bollinger Bands to identify potential trading opportunities in the markets.
The basic idea behind the Bollinger Band Breakout strategy is to buy when the price breaks above the upper band and to sell when the price breaks below the lower band. This signals a potential change in market volatility and an opportunity to enter or exit a trade.
To implement the Bollinger Band Breakout strategy, traders typically use the 20-day moving average and 2 standard deviation lines as their default settings. When the price breaks above the upper band, it is considered a bullish signal and traders look to enter a long position. Conversely, when the price breaks below the lower band, it is considered a bearish signal and traders look to enter a short position.
It is important to note that Bollinger Bands are not a guarantee of future price action and should not be used as the sole basis for a trading decision. Traders should also consider other factors such as market trends, economic data releases, and technical indicators before making a trade.
Overall, the Bollinger Band Breakout strategy can be a useful tool for traders who are looking to capitalize on changes in market volatility and identify potential trading opportunities.
Section 7 / 12
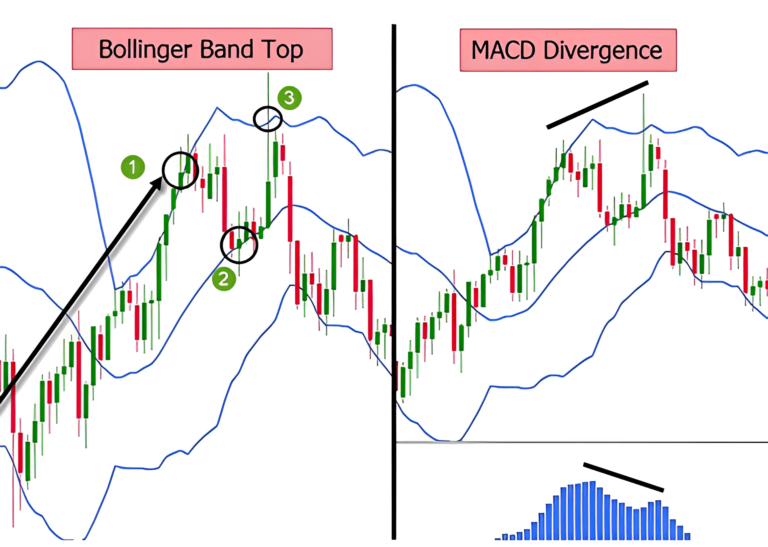
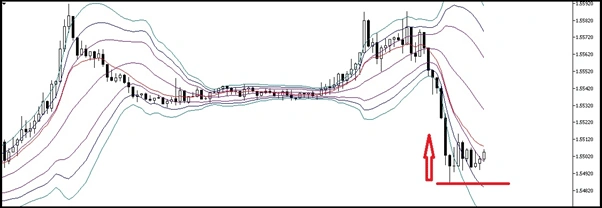
Trading reversals using Bollinger bands
Reversal strategy using Bollinger Bands involves identifying trend changes in price movements by using the bands as a tool for detecting volatility and potential reversals in the market.
The Bollinger Bands consist of a middle band (typically a 20-day moving average) and two outer bands that act as price targets for the upper and lower bounds of the market. When prices reach the upper band, it is considered overbought, and when prices reach the lower band, it is considered oversold.
To implement a reversal strategy using Bollinger Bands, traders typically look for the price to reach the upper or lower band and then wait for a confirmation signal, such as a candlestick reversal pattern or a move below or above the band. If the confirmation signal occurs, they may enter a trade in the opposite direction of the previous trend.
Section 8 / 12
Range trading using Bollinger bands
Range trading is a trading strategy that involves buying low and selling high within a defined price range. Bollinger bands are a widely used technical analysis tool that can aid traders in identifying the range by showing the upper and lower bounds of price action. Bollinger bands vary in the number of periods used to calculate the moving average and the standard deviations, with 20 periods and two standard deviations being the most common setting. The bands adjust as prices move, expanding during periods of increased volatility and contracting during periods of decreased volatility. When using Bollinger bands for range trading, traders look for opportunities to buy at the lower band and sell at the upper band. If prices reach the upper band, the trader may consider selling, as prices may be considered overbought and due for a pullback. Similarly, if prices reach the lower band, the trader may consider buying, as prices may be considered oversold and due for a rebound. In conclusion, Bollinger bands can be a useful tool for range traders looking to identify the boundaries of price action and make informed trading decisions based on market conditions. However, it’s important to note that Bollinger bands varies in the parameters used, and traders should select a setting that best suits their trading style and market conditions. 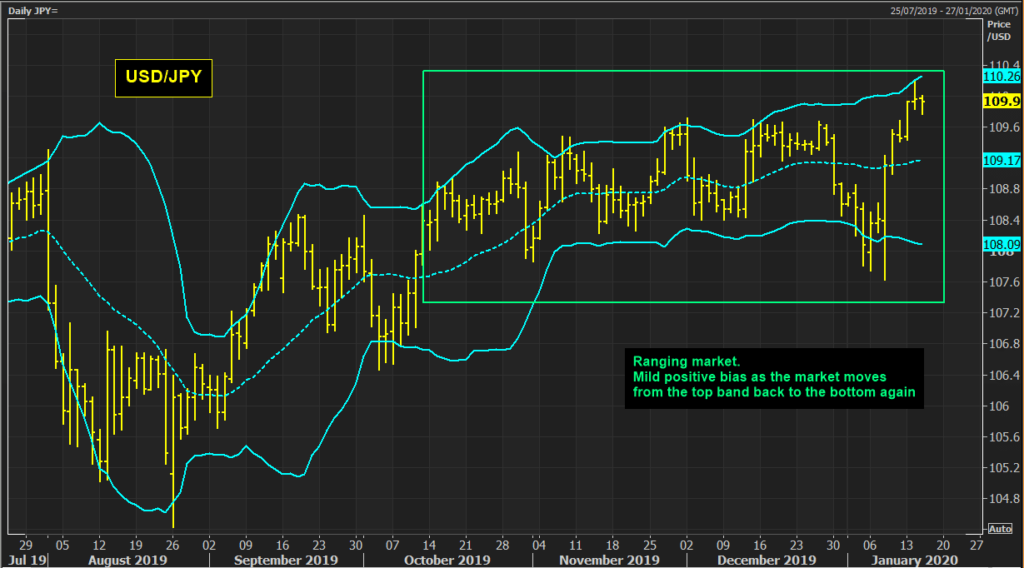
Section 9 / 12
Limitations of Bollinger Bands
- Lagging Indicator: Bollinger Bands are inherently reactive. They calculate the standard deviation of past price movements to create the bands, reflecting past volatility rather than predicting future price action. This can be a disadvantage, particularly during heightened volatility or sudden breakouts, where the bands may need to adjust more quickly to capture the full price swing.
- Market Dependency: Bollinger Bands function most effectively in trending markets. Their ability to generate reliable signals diminishes in sideways markets characterised by price consolidation and minimal volatility. The bands tend to tighten during such periods, offering limited information on potential price direction.
- False Signals: Low-volatility environments can lead to deceptive Bollinger Band squeezes. These squeezes, which visually suggest an impending breakout due to the bands contracting, can be misleading. Price movements may not necessarily follow the anticipated breakout pattern, resulting in false signals and potentially unprofitable trades.
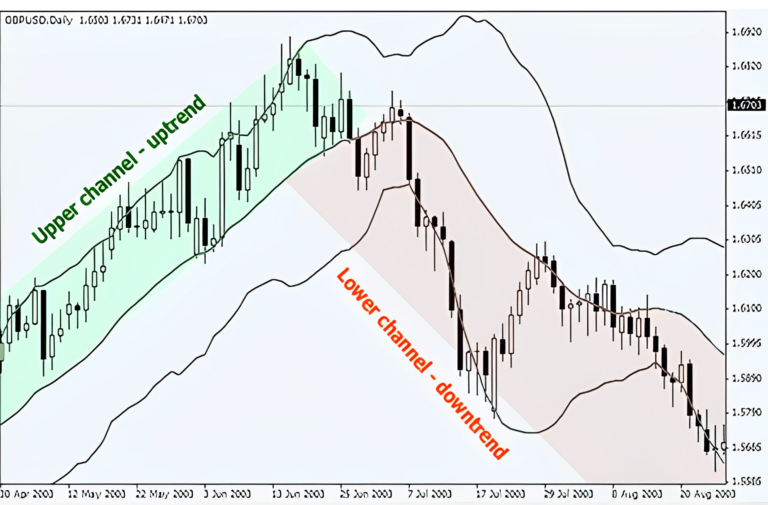
- Limited Trend Directionality: While Bollinger Bands excel at highlighting volatility changes, they do not explicitly indicate the underlying trend direction (uptrend, downtrend, or sideways). Traders must incorporate additional technical analysis tools, such as moving averages, trendlines, etc., to better understand the prevailing market trend.
Section 10 / 12
Beyond the Limitations: Unleashing the Potential of Bollinger Bands
By acknowledging these limitations and employing Bollinger Bands strategically, traders can leverage their strengths:
- Identifying Overbought/Oversold Conditions: When the price reaches the upper Bollinger Band, it may signal overbought territory, suggesting a potential price correction. Conversely, a price touching the lower Bollinger Band may indicate oversold conditions, hinting at a possible price rebound. However, confirming these signals with other technical indicators, such as momentum oscillators or candlestick reversal patterns, is essential before entering trades.
- Gauging Volatility: The Bollinger Band width is a valuable market volatility indicator. Expanding bands typically signify increased volatility, potentially foreshadowing significant price movements. Conversely, contracting bands suggest lower volatility, which can be useful for identifying potential consolidation periods.
- Volatility Contraction and Breakout Strategies: A tightening of the Bollinger Bands can be a precursor to a breakout, either upwards or downwards. Traders can use support and resistance levels to identify potential breakout zones and capitalise on these price movements. However, caution is vital, as these breakouts may be false due to the limitations mentioned.
Section 11 / 12
The Importance of Risk Management: A Safety Net for Bollinger Band Trading
Regardless of the technical indicator employed, robust risk management practices are paramount for sustainable success in trading. Here’s how Bollinger Bands can be incorporated into a risk management framework:
- Strategic Stop-Loss Orders: Stop-loss orders are essential to mitigate potential losses. During Bollinger Band squeezes, where breakouts may be false, placing stop-loss orders becomes even more critical.
- Position Sizing Based on Volatility: Bollinger Band width can be used as a guide for position sizing. During periods of high volatility (expanding bands), adopting smaller positions helps manage risk. Conversely, lower volatility periods (contracting bands) might allow for larger positions, but always within the confines of your risk tolerance.
- Confirmation is Key: Never base a trade solely on a Bollinger Band signal. Always seek confirmation from other technical indicators or fundamental analysis to bolster your trading decisions.
Section 12 / 12
Finding Perfect Platform
Most reputable forex trading platforms offer Bollinger Bands as a standard technical indicator. When selecting a platform, consider features such as customising Bollinger Band settings, including the number of standard deviations used to calculate the bands. Additional features like price alerts based on Bollinger Bands touches can further enhance your trading experience.
Here’s an overview of some notable trading platforms and software that offer Bollinger Bands as part of their technical analysis suite:
- Meta Trader 4 and Meta Trader 5 (MT4/MT5)
- Platform Type: Desktop, Mobile
- Overview: Meta Trader is one of the most widely used forex and futures trading platforms. It offers a comprehensive range of technical analysis tools, including Bollinger Bands.
- Features: Customizable charts, multiple timeframes, expert advisors (EAs) for automated trading, and a vast library of indicators.
- Trading View
- Platform Type: Web-based, Mobile
- Overview: Trading View is a robust charting platform catering to beginner and advanced traders. Its social community feature allows users to share and discuss trading ideas.
- Features: Highly customisable charts, extensive library of technical indicators, a scripting language (Pine Script) for creating custom indicators, and a vibrant community of traders.