
How to tell a normal drawdown from a blow-up, understand the account mechanics and rebuild risk controls
A trading account blow-up happens when losses or poor risk management wipe out most or all trading capital.
Blowing up an account rarely comes from one bad trade. More often, it’s the spiral of revenge trading — where emotional pressure can make it harder to follow the risk rules you set when you were calm. The first step in recovery isn’t charts or strategies; it’s about shifting back from being an emotional actor to a disciplined observer.
A trading account blow-up is a severe loss of capital caused by excessive risk, oversized positions, loss-chasing, uncontrolled leverage or repeated breaks from a trading plan. A drawdown, by contrast, is a decline from a previous account-equity peak that can occur while a trader is still following a tested strategy and defined risk limits. The difference is not simply the size of the loss; it is whether risk and execution remain under control. Common causes of a blow-up include revenge trading, increasing position size after losses, moving stops, overtrading, excessive leverage and holding positions beyond predefined limits.
Is This a Blow-Up or Just a Drawdown?
A drawdown is a decline from a previous account-equity peak and can occur while a trader is still following a tested plan. A blow-up spiral is different: the damage is being accelerated by broken risk rules, oversized exposure, loss-chasing or uncontrolled leverage. The percentage loss alone cannot diagnose which one you are in.
How many losing trades in a row is normal?
Losing streaks are mathematically possible even when a system wins more often than it loses. The table below assumes 100 independent trades, a constant win rate and unchanged trade risk. It shows both the expected longest losing streak in that 100-trade sample and the probability of seeing at least one streak of the stated length.
| Win rate | Expected longest losing streak in 100 trades | Chance of 5+ consecutive losses | Chance of 7+ consecutive losses |
|---|---|---|---|
| 50% | About 6 losses | 81.0% | 31.8% |
| 55% | About 5.3 losses | 64.7% | 17.9% |
A 10-loss streak is less common but still possible: about 4.4% over 100 trades for a 50% win-rate system and about 1.7% for a 55% system under the same assumptions. Real strategies may have correlated outcomes, changing win rates and unequal wins and losses, so these figures are illustrations of variance, not a forecast of account drawdown.
What does normal variance look like for a 50% or 55% system?
Win rate is only one part of drawdown. A 50% or 55% system can still experience a severe losing streak if losses are larger than wins, trades are correlated, position size is too high or market conditions change. Compare the current loss sequence with the strategy’s tested distribution of returns and drawdowns rather than using a fixed percentage threshold.
- More consistent with a drawdown: entries, exits and position sizing still match the written plan; losses remain within the strategy’s tested or simulated range; and risk has not increased after losses.
- More consistent with a blow-up spiral: position size rises after losses, stops are moved farther away, trades are taken outside the plan, leverage increases to recover faster, or the trader cannot stop at the predefined loss limit.
Drawdown vs. blow-up: quick check
| Question | More consistent with a drawdown | More consistent with a blow-up spiral |
|---|---|---|
| Are you following the same strategy rules? | Yes | No; entries or exits are changing under pressure |
| Has risk per trade increased after losses? | No | Yes |
| Are stops being respected? | Yes | No; stops are removed or moved farther away |
| Are you taking extra trades to recover losses? | No | Yes; revenge trading or overtrading |
| Does the current drawdown fit tested/simulated results? | Broadly yes | No, or the strategy was never adequately tested |
What is risk of ruin?
Risk of ruin is the probability that a sequence of losses reduces capital below the level needed to continue trading the strategy. It is not determined by win rate alone. Expectancy, average win and loss size, position sizing, leverage, costs and the sequence of outcomes all matter. As position risk rises, the account has less room to survive an adverse sequence.
For Hantec Markets guidance on position size, stop-losses and risk limits, see The Trading Risk Management Strategy.
Realised vs. Unrealised: The Psychology of the “Exit”
There’s a world of difference between an unrealised loss (still open, still “hopeful”) and a realised loss (closed, final).
- As long as a trade is open, the mind clings to the possibility of a turnaround.
- Closing it forces the brain to accept reality, and that crystallisation of loss is where the pain hits the hardest.
But here’s the paradox: only once the loss is realised can recovery and learning truly begin.
Case Study: The “Martingale” Trap
Picture Trader A with a $10,000 account. After three losses, frustration set in. Convinced the market “owed” them a win, they doubled their lot size on the fourth trade.
- The market moved 50 pips against them; drawdown ballooned to 40%.
- Panic took over, and they held through a weekend news event.
- The market gapped, the stop slipped, and by Monday morning the account was gone.
The takeaway: The blow-up wasn’t about a bad prediction. It was about refusing to accept a small, manageable loss — turning it into a catastrophic emotional one.
Why Did My Trading Account Blow Up?
Use four checks: strategy, risk management, execution and psychology. The purpose is to answer one question clearly: did the strategy fail while you followed it, or did the loss become catastrophic because the trading and risk rules were broken?
Strategy failure
Ask whether the strategy had credible positive expectancy before the loss sequence.
- Was it tested across a sufficiently large and relevant sample of trades? There is no universal number that proves a strategy works; the required sample depends on the size and stability of the edge.
- Did market conditions change? A strategy that performs in a persistent trend may behave differently in a range, and vice versa.
- Were the losses consistent with the strategy’s historical or simulated drawdowns, or materially outside them?
Risk-management failure
A strategy can have positive expectancy and still suffer severe losses if the amount at risk becomes too large.
- Excessive position size relative to account equity.
- Excessive leverage or too little free margin.
- No predefined stop-loss or exit condition.
- Moving a stop-loss farther away after the market moves against the position.
- Too much capital exposed to one trade, one theme or strongly correlated positions.
- Increasing risk after losses in an attempt to recover faster.
Execution failure
Execution failure means the plan existed, but the trades no longer followed it.
- Entering trades outside the defined setup.
- Revenge trading immediately after a loss.
- Overtrading beyond the planned frequency.
- Holding through major scheduled events when the plan says not to.
- Abandoning predefined exits once the position is open.
Psychological failure
Emotional pressure can contribute to strategy, risk and execution errors. Common patterns include:
- Fear: avoiding valid setups or closing winners early because a recent loss is still influencing the decision.
- Greed: increasing leverage or holding for an unplanned target.
- Loss aversion: resisting a planned exit because realising the loss feels worse than leaving it open.
- FOMO: entering after the planned setup has already passed.
- Revenge: trading to erase a previous loss rather than because a valid setup exists.
- Gambler’s fallacy: believing a win is now “due” because several independent losses came first.
Key takeaway: If the rules were followed and the strategy still produced unacceptable losses, investigate strategy validity. If the rules changed during the loss sequence, fix the risk and execution process before considering new capital.
Hantec Markets also covers the distinction between strategy-related and off-strategy losses in Turning Losses into Wins: How to Handle Trading Setbacks.
How the Account Actually Hits Zero: Margin Calls, Stop-Outs and Negative Balance
A leveraged trading account can be forced into liquidation before the cash balance literally reaches zero. The key variable is equity relative to used margin. If equity falls far enough, the broker can restrict new trading or close positions under the account’s margin and stop-out rules.
How do margin level, margin calls and stop-outs work?
Margin level = (Equity ÷ Used Margin) × 100
- Equity is the account balance adjusted for unrealised profit and loss on open positions.
- Used margin is the margin currently supporting open leveraged positions.
- A margin call is a warning or account state indicating that available equity is becoming insufficient. The trigger is provider- and account-specific; it is not a universal percentage.
- A stop-out is the forced-liquidation threshold at which the broker begins closing positions according to its terms.
Worked margin example
Assume a $10,000 account with $2,000 of used margin. Hantec Markets’ current retail trading-condition pages state a stop-out level “from 20%”; the exact level can vary by account, instrument and legal entity, so the live account specification takes priority.
| Stage | Equity | Used margin | Margin level |
|---|---|---|---|
| At entry | $10,000 | $2,000 | 500% |
| After a $6,000 unrealised loss | $4,000 | $2,000 | 200% |
| After an $8,000 unrealised loss | $2,000 | $2,000 | 100% |
| At a 20% margin level | $400 | $2,000 | 20% |
In this simplified example, a 20% stop-out corresponds to $400 of equity while used margin remains $2,000. In practice, used margin can change as positions are closed, and the broker’s exact liquidation process is governed by the current account terms. Do not assume that 20% is the stop-out level for every Hantec Markets account.
Current Hantec Markets trading conditions can be checked here: Forex Trading Conditions.
Why do gaps cause slippage, and why is a stop not a guarantee?
A standard stop-loss triggers an order when the stop level is reached or breached, but the execution price can differ from the requested stop price when the market moves quickly or liquidity is limited. If the market gaps through the stop level, there may be no executable price at the stop itself.
- Weekend gaps, major news and sudden liquidity changes can produce slippage.
- A standard stop does not create liquidity at the requested price; it is normally executed at the best available price once triggered.
- Gap slippage can occur as part of ordinary market mechanics and is not, by itself, evidence of broker misconduct. Hantec Markets’ Execution Policy states that prices can widen, markets can become volatile or gap, and an execution price is not guaranteed.
Hantec Markets explains standard stop-loss execution and slippage in Introduction to Stop-Loss Orders, and its Execution Policy explains how market conditions can affect fills.
What is a guaranteed stop?
A guaranteed stop is a separate broker feature offered by some providers that commits to close a position at the specified stop price under stated conditions, even if the market gaps. Availability, eligible instruments and charges vary. Do not assume a guaranteed stop is available on a particular Hantec Markets account unless the current product terms explicitly confirm it.
What is negative balance protection, and who does it apply to?
Negative balance protection is a backstop that limits an eligible client’s liability so a covered CFD trading account is not left owing more than the funds protected under the applicable rule or broker policy. It does not prevent ordinary trading losses, margin calls or stop-outs.
- UK retail CFDs: FCA rules require protections that prevent a retail client from losing more than the total funds in the CFD account and require margin close-out at 50% of the required margin.
- EU retail CFDs: ESMA’s CFD product-intervention framework introduced a 50% account-level margin close-out rule and negative balance protection; applicable national rules should be checked for the client’s jurisdiction.
- Hantec Markets: Hantec Balance Guard currently states that negative balance protection applies automatically to eligible Hantec Global, Hantec Pro and Hantec Cent individual trading accounts. Eligibility and terms should be checked before relying on the protection.
See Hantec Balance Guard for the current Hantec Markets eligibility wording.
The Math of the Comeback (Risk Management)
The Exponential Wall of Recovery
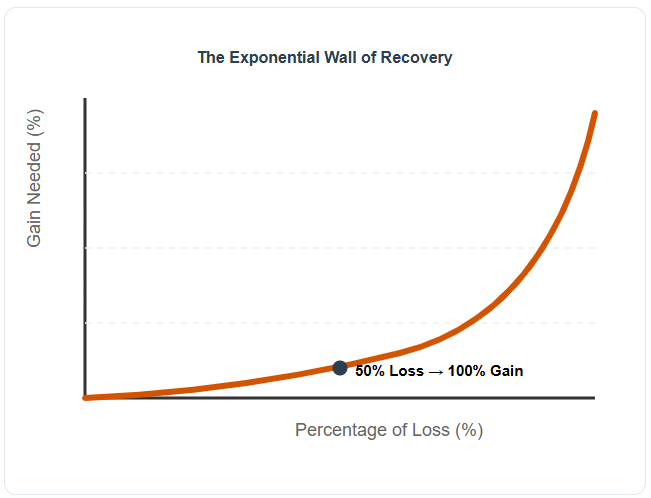
Recovery isn’t about “getting back” what you lost — it’s about math. Lose 50% of your capital, and you don’t need a 50% gain to recover. You need 100%.
Recovery % = [(1 ÷ (1 − L)) − 1] × 100
Where L is the loss expressed as a decimal.
| Account loss | Gain needed to recover |
|---|---|
| 10% | 11.1% |
| 20% | 25% |
| 30% | 42.9% |
| 40% | 66.7% |
| 50% | 100% |
| 60% | 150% |
| 70% | 233.3% |
| 80% | 400% |
| 90% | 900% |
- A 20% loss needs a 25% gain to recover.
- A 60% loss needs a 150% gain to recover.
This is why drawdown control matters. If risk is fixed at 1% of remaining equity per trade, 20 consecutive full-risk losses leave about 81.8% of the starting equity. That does not make the strategy safe or profitable; it simply illustrates how smaller fixed-fraction risk slows the rate at which capital is depleted.
How long can a deep drawdown take to recover?
The recovery percentage understates the time problem. After a 60% drawdown, the account is at 40% of its starting value and must grow by 150% to get back to the starting level. Even under smooth hypothetical monthly gains, the recovery can take years.
| Hypothetical net monthly growth | Approximate time to recover from a 60% drawdown |
|---|---|
| 1% every month | 93 months (about 7.7 years) |
| 2% every month | 47 months (about 3.9 years) |
| 3% every month | 31 months (about 2.6 years) |
These are mathematical illustrations, not expected or “realistic” return forecasts. Real trading results are uneven and can include further drawdowns, spreads, commissions, financing and periods with no trades. The point is that trying to force a deep recovery into a few weeks by increasing leverage raises the chance of another large loss.
Data & Research: The “Trader’s Bias”
Kahneman and Tversky’s Prospect Theory models gains and losses relative to a reference point and describes a value function that is generally steeper for losses than for gains. In trading, this helps explain why a trader may become more willing to take risk to avoid realising a loss.
- Loss aversion can encourage a trader to hold a losing position longer than the original plan allowed.
- In the Chague, De-Losso and Giovannetti study of people who began day trading Brazilian equity futures between 2013 and 2015, 97% of those who persisted for at least 300 days lost money. The 2019 working-paper version reported that only 0.4% earned more than a bank teller (US$54 per day), while the top individual averaged US$310 per day with high variability.
This study is evidence from one market, period and trader population. It should not be presented as a universal statistic for every retail trader, asset class or first trading account.
How to Calculate Position Size After a Drawdown
After a large loss, the instinct to increase position size can be strong: make the next trade bigger and recover the account faster. That is exactly the point at which risk controls matter most.
Position size should be calculated from the amount you are prepared to lose if the stop-loss is reached, not from the amount you want to recover.
A simple framework is:
=
Then:
=
Worked example
Assume a trader has:
- Account equity: $8,000
- Maximum risk per trade: 1%
- Stop-loss: 40 pips
- Pip value: $10 per pip for a standard lot
The maximum planned loss is:
$8,000 × 1% = $80
The position size is therefore:
$80 ÷ (40 × $10) = 0.20 lots
The important point is that the position is being sized from the remaining account equity and predefined risk, not from the previous $10,000 balance or the amount the trader wants to win back.
After a drawdown, this distinction becomes critical. If the account falls from $10,000 to $8,000, a 1% risk limit based on the current $8,000 equity is $80, not $100. As the account changes, the risk amount should change with it.
Do not increase size to recover losses
A larger position does not make recovery more likely. It increases the amount that can be lost if the next trade fails.
The recovery objective should therefore be separated from the trade-risk decision:
Account equity → risk limit → stop-loss distance → position size
not:
Previous loss → desired recovery amount → larger position
A trader who has just experienced a large drawdown may also consider temporarily reducing the percentage risk per trade. The purpose is not to recover more quickly, but to reduce the probability that another adverse sequence turns a drawdown into a further loss of control.
The calculation should also account for the instrument being traded, contract specifications, currency conversion, spread, commissions and the actual execution conditions. The exact monetary value of a point or pip varies between instruments, so traders should verify the contract specifications for the position they are opening.
The objective after a drawdown is not to trade bigger. It is to make the next loss small enough that the account still has room to continue.
A Note on Tax-Loss Harvesting
The tax treatment of realised trading losses varies by jurisdiction, product and account type. Some tax systems allow certain losses to offset gains or be carried forward; others treat derivatives differently. Traders should check the rules that apply to them or use qualified tax advice rather than assuming a trading loss is deductible.
A Practical 90-Day Rebuild Framework
| Period | Mode | What to do / measure |
|---|---|---|
| Days 1–7 | Stop | No live trading, demo trading or chart-watching for new setups. Write a post-mortem: which rule broke first, when it broke, what changed in position size or exit logic, and what you were trying to achieve at that moment. |
| Days 8–30 | Demo only | Use fixed sizing rules, a hard daily loss limit and a journal. Record the setup, planned risk, exit and a simple pre-trade emotional-state score. Measure success by rule adherence, not demo P&L. |
| Days 31–60 | Micro live | Only consider live trading if the demo phase shows consistent adherence. Use the smallest practical exposure and only money you can afford to lose. Keep the same rules and continue measuring adherence rather than profit. |
| Days 61–90 | Scale slowly | Make only one size increase after 30 days of clean adherence. If a core rule is broken, reduce size again or return to demo until the process is stable. |
Broker & Platform Guardrails: Preventing Recurrence
The aim is to make the risk rules harder to override in the moment. Availability varies by broker, platform, account and prop-firm program, so use only controls that the provider actually supports and verify the current terms.
Maximum daily drawdown limits
Some prop-firm programs and risk-management tools enforce hard daily-loss or maximum-open-risk rules that can trigger a breach or liquidation. Standard retail CFD accounts do not all provide a user-configurable daily-loss lock. If your provider offers one, set it before trading; if it does not, use predefined stops, alerts and a written stop-trading rule rather than assuming the platform will protect you automatically.
Leverage caps
Lower leverage reduces the maximum exposure that can be opened with a given amount of margin. If an account allows the user to choose a lower leverage setting, reducing it can act as a structural risk limit. If the leverage setting cannot be changed, the same practical effect can be achieved by using smaller position sizes. Regulatory leverage limits also vary by jurisdiction and client classification.
Hantec Markets’ Global account currently advertises maximum leverage up to 1:500, while retail leverage can be lower where local rules apply. The maximum available leverage should not be treated as a recommended trade size.
Trading lockouts and cooling-off controls
Relying on willpower after a severe loss is a common point of failure. Utilising built-in platform tools or third-party risk management software to temporarily disable trading access can break the emotional feedback loop. By setting a hard lockout after hitting a predefined daily loss threshold, you force a mandatory cooling-off period. Some trading platforms and firm portals allow you to place a time-delay on unlocking the account or require administrative steps to lift the restriction, ensuring you cannot immediately revenge-trade while in an escalated emotional state.
Negative balance protection is a backstop, not a trading plan
Hantec Balance Guard can limit an eligible account from remaining below zero, but it does not prevent a trader from losing the funds in the account. Position sizing, stop discipline and free margin still matter.
Conclusion
A trading-account blow-up is best treated as a diagnostic event, not a signal to recover the money quickly. First identify whether the failure came from the strategy, risk sizing, execution or a sequence of rule-breaking decisions. Then rebuild only if the new process can be followed at lower exposure.
The recovery table explains why capital preservation matters; the margin section explains why leverage can turn a drawdown into forced liquidation; and the 90-day protocol gives a staged way to test whether the behaviour has actually changed. There is no requirement to return to live trading on a deadline.
FAQ: Navigating the Aftermath
Q: Should I jump back in right away to stay sharp?
A: No if the main motivation is to recover the loss. The rebuild framework above starts with seven days without live or demo trading so the first task is diagnosis rather than finding the next setup.
Q: How do I know I’m ready to return?
A: Use process criteria. You should be able to state the setup, maximum risk, stop condition, daily loss limit and exit plan before entry, then follow those rules consistently in a lower-risk environment. If the rules still change after a loss, you are not ready to scale.
Q: Should I deposit more money immediately?
A: Do not add funds simply to restore the old account balance. First identify the cause of the loss, change the risk or execution process that caused it, and test the revised process. Any future trading capital should be money you can afford to lose.
Q: Can I lose more than I deposit?
A: It depends on the account, product, jurisdiction and client classification. UK retail CFD rules include negative balance protection, and Hantec Balance Guard states that eligible Hantec Global, Pro and Cent individual accounts receive negative balance protection under its current terms. Check the protection that applies to your exact account before relying on it.
Q: How do I explain this to my partner?
A: Give the exact figures: the amount lost, the current account balance, any debt or open exposure, and whether shared household money was affected. Stop additional deposits while you assess the damage, show the safeguards you would use before risking money again, and agree boundaries for shared finances. If the loss affects essential bills or created unaffordable debt, use regulated financial or debt advice in your jurisdiction.
Q: Is it normal to lose your first account?
A: Trading losses are common, but blowing up a first account should not be treated as inevitable or as a required milestone. The widely cited 97% study applies to a specific group of Brazilian equity-futures day traders who persisted for at least 300 days; it is not a statistic about every trader’s first account. A blow-up is a reason to stop and diagnose the process before deciding whether to trade again.
Q: How do I know if I’m trading or gambling?
A: Trading is rule-based: the setup, risk, size and exit are defined before entry and performance is reviewed over a series of trades. Gambling-like behaviour appears when size rises after losses, entries are taken to recover money rather than because a setup exists, money is borrowed to keep trading, or the trader feels unable to stop. If you cannot stop, are hiding losses or are using money needed for essential expenses, stop live trading and seek appropriate financial, debt or gambling-support help.
Calculation notes
Calculation notes: drawdown-recovery percentages use the formula [(1 ÷ (1 − L)) − 1] × 100. Recovery-time examples compound the stated hypothetical monthly growth rate until a 60% drawdown (40% of starting equity) returns to 100%. Losing-streak figures are exact calculations for 100 independent Bernoulli trades at constant 50% and 55% win rates; real trade outcomes may not be independent.
Disclaimer: The content of this article is intended for informational purposes only and should not be considered professional advice.