

Trading Gold (XAU/USD) offers exceptional liquidity and significant trading opportunities, but its unique market structure catches many traders off guard. Many traders can correctly identify the broader market direction and still lose money because volatility, spread expansion and excessive leverage overwhelm their position sizing. They fail because Gold’s inherent volatility, sudden spread expansions, and leverage mechanics can cause significant losses before the broader trade thesis plays out. Unlike traditional Forex currency pairs, Gold moves with high velocity driven by macroeconomic shifts, real interest rates, and structural reserve buying tracked by the World Gold Council. Long-term profitability in XAU/USD depends far less on finding a perfect entry strategy and far more on maintaining a rigorous, adaptive risk management framework.
Table of Contents
- Why Gold Is More Volatile Than Standard Forex Markets
- Session-Based Volatility and Operational Liquidity
- The Mathematical Reality of Account Drawdowns
- The Mathematical Asymmetry of Drawdown Recovery
- Dynamic Position Sizing Protocols
- XAU/USD Lot Size Definitions and P/L Impact
- Position Size Formula
- Practical Execution Scenarios ($10,000 Account)
- Leverage Restrictions and Execution Rules
- Baseline News Execution Policy: The 30/30 Rule
- Structural Stop Loss Frameworks and Return Asymmetry
- Intermarket Correlation Mechanics
- Pre-Trade Checklist and Execution Pitfalls
Why Gold Is More Volatile Than Standard Forex Markets
Gold functions simultaneously as a physical commodity, a global currency benchmark, and a primary safe-haven asset. Because of this multi-faceted nature, XAU/USD reacts aggressively to geopolitical conflicts, shifts in U.S. Dollar strength, and real interest rate expectations, as reflected in official Federal Reserve Economic Data (FRED).
This structural background causes Gold to move with significantly higher amplitude than traditional foreign exchange pairs:
- Forex Major Pairs: Standard pairs like EUR/USD typically average daily swings between 60 and 80 pips, while GBP/USD ranges between 80 and 110 pips.
- Gold (XAU/USD): Regularly ranges between 2,500 and 4,500 pips ($25 to $45) in a single trading session.
Price swings that would take several trading days to unfold in major Forex markets often occur in Gold within a few hours.
Session-Based Volatility and Operational Liquidity
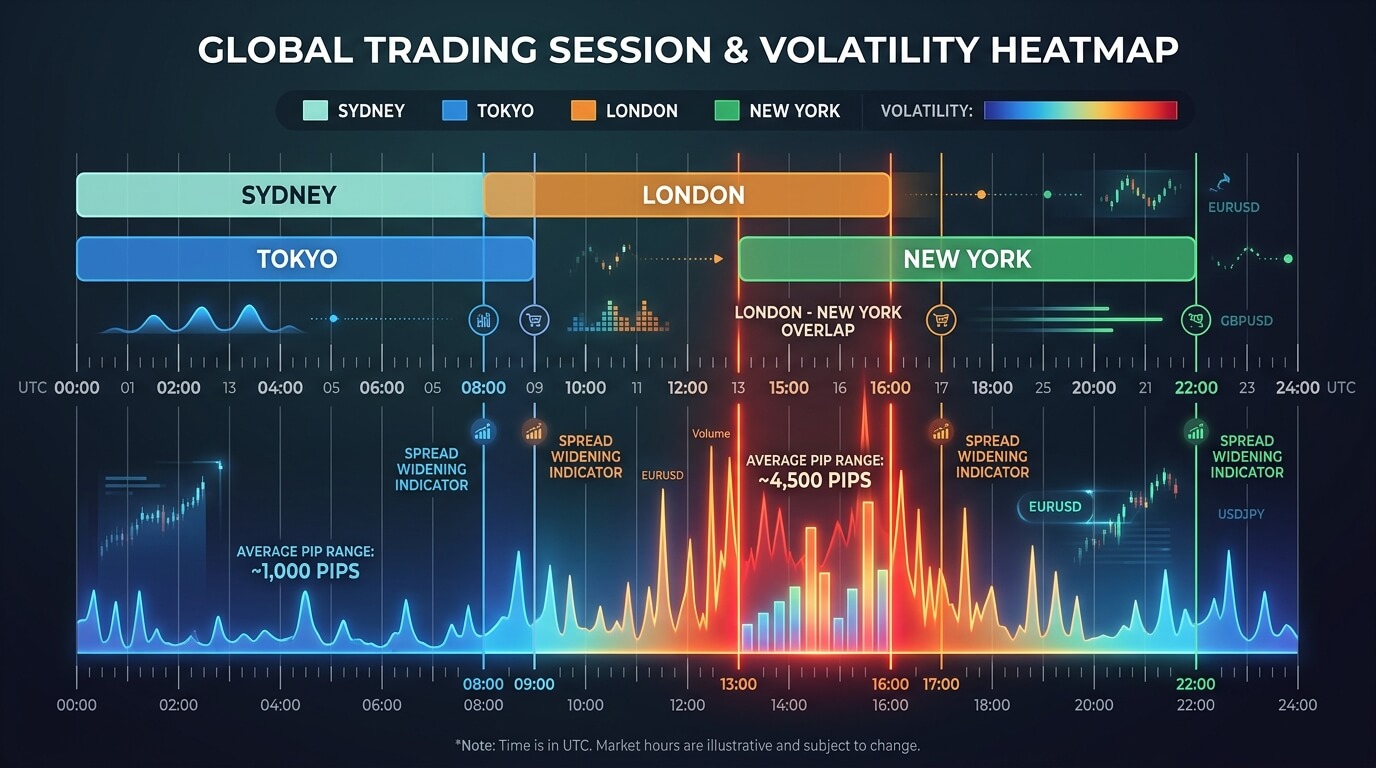
Gold’s intraday dynamics change significantly across major global trading hubs. Because XAU/USD operates 24 hours a day, failing to account for session transitions often exposes traders to sudden liquidity voids and unexpected spread expansions:
- Asian Session (Tokyo/Sydney): Characterized by low volume and narrow price ranges. Spreads are typically wider, and breakout setups during this window carry a high rate of false expansion.
- London Session: Represents the first massive influx of institutional volume. Structural breaks established during early London trading often dictate the primary trend for the first half of the day.
- London / New York Overlap (13:00 to 16:00 UTC): The London/New York Overlap represents the period of peak market liquidity and maximum price velocity. Macro economic releases intersect with overlapping order books, creating high-probability trending opportunities alongside elevated risk of slippage.
Attempting to execute tight intraday strategies during session transitions or low-liquidity Asian consolidation frequently leads to premature stop-outs driven purely by spread expansion rather than structural trend failure.
The Mathematical Reality of Account Drawdowns
Retail broker statistics and regulatory disclosures mandated by financial authorities consistently reveal that over 70% of retail traders lose capital long-term. The primary technical cause of account failure in volatile assets like Gold is asymmetric leverage damage. A single unmanaged drawdown requires exponentially higher percentage gains just to return to break-even equity.
| Account Loss | Required Gain to Break Even | Impact Level on Capital |
|---|---|---|
| 10% | 11.1% | Minor / Easily Recoverable |
| 25% | 33.3% | Moderate / Requires Disciplined Execution |
| 50% | 100.0% | Severe / Requires Doubling Account Equity |
| 75% | 300.0% | Catastrophic / High Liquidation Risk |
The Mathematical Asymmetry of Drawdown Recovery
A core principle of capital preservation is that loss and recovery percentages operate on an asymmetrical scale. Because compounding works against a declining balance, a loss requires an exponentially larger gain just to restore initial account equity:
- A 10% drawdown requires an 11.1% gain to return to break-even.
- A 25% drawdown requires a 33.3% gain to return to break-even.
- A 50% drawdown requires a 100.0% gain (doubling the remaining account) just to recover initial capital.
This mathematical reality demonstrates why reducing the size and frequency of losing trades is structurally more important for long-term survival than attempting to increase the win rate or reward-to-risk ratio on winning positions. Preventing deep drawdowns eliminates the need for aggressive, high-risk recovery trades.
Dynamic Position Sizing Protocols
Managing risk in Gold trading requires two distinct, complementary layers of capital control:
Layer 1: Base Financial Risk Allocation (Cash Exposure)
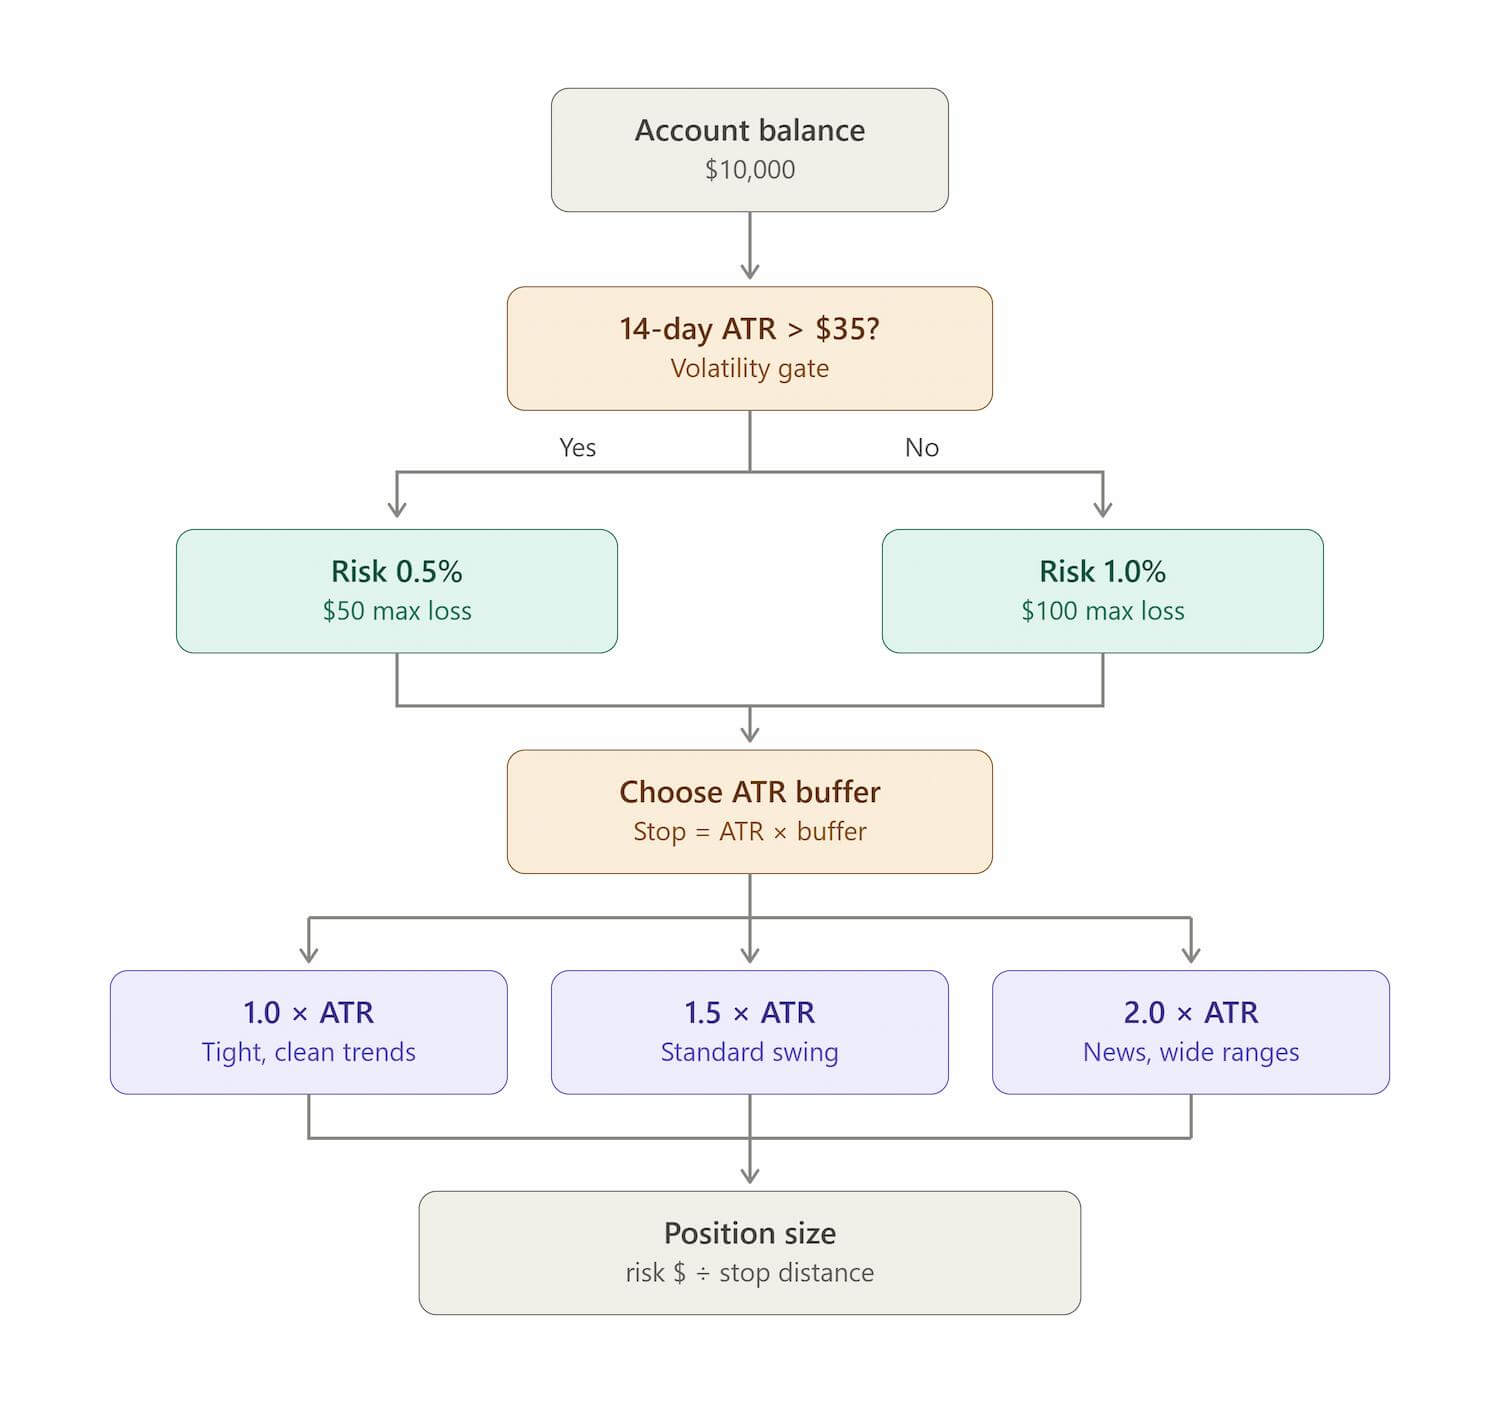
Under normal market conditions, baseline risk is set at 1.0% of total account equity per trade. During extreme volatility regimes (e.g., major geopolitical events or unannounced central bank decisions), traders should cut absolute cash exposure in half—reducing risk to 0.5% per trade. The absolute ceiling is 2.0% per trade, which should never be exceeded under any circumstances.
Layer 2: Volatility-Adjusted Lot Sizing (Technical Stop Expansion)
Even when maintaining a fixed 1.0% cash exposure, high volatility expands price swings (ATR). To keep total dollar risk constant, position size must shrink proportionally as the technical stop loss expands.
XAU/USD Lot Size Definitions and P/L Impact
To eliminate execution ambiguity, lot calculations throughout this guide reflect standard retail broker specifications (MetaTrader / Webtrader):
- 1.00 Standard Lot: Every $1.00 move in Gold equals a $100.00 P/L change.
- 0.10 Mini Lot: Every $1.00 move in Gold equals a $10.00 P/L change.
- 0.01 Micro Lot: Every $1.00 move in Gold equals a $1.00 P/L change.
(Note: Always double-check your broker’s contract specification by right-clicking XAU/USD in your platform’s Market Watch and selecting “Specification” to confirm standard lot value).
Position Size Formula
Position Size (Lots) = Max Cash Risk / (Stop Loss Distance in $ x $100)
(The $100 multiplier represents the standard market payout per 1.00 Standard Lot).
| Account Size | Risk % | Max Cash Risk | Stop Loss Width ($ / Pips) | Position Size (Lots) |
|---|---|---|---|---|
| $1,000 | 1.0% | $10.00 | $5.00 move (500 pips) | 0.02 Lot (Micro) |
| $1,000 | 1.0% | $10.00 | $10.00 move (1,000 pips) | 0.01 Lot (Micro) |
| $10,000 | 1.0% | $100.00 | $5.00 move (500 pips) | 0.20 Lot (Mini) |
| $10,000 | 1.0% | $100.00 | $10.00 move (1,000 pips) | 0.10 Lot (Mini) |
| $50,000 | 1.0% | $500.00 | $5.00 move (500 pips) | 1.00 Lot (Standard) |
| $50,000 | 1.0% | $500.00 | $10.00 move (1,000 pips) | 0.50 Lot (Standard) |
Practical Execution Scenarios ($10,000 Account)
Normal Volatility (1.0% Risk / $5.00 Stop Loss): $100 Cash Risk / ($5.00 Stop x $100) = 0.20 Lots (2 Mini Lots)
(If Gold drops $5.00, your 0.20 lot loses exactly $100).
High Volatility (1.0% Risk / $10.00 Stop Loss): $100 Cash Risk / ($10.00 Stop x $100) = 0.10 Lots (1 Mini Lot)
(If Gold drops $10.00, your 0.10 lot loses exactly $100).
Extreme Volatility Regime (0.5% Reduced Cash Risk / $10.00 Stop Loss): $50 Cash Risk / ($10.00 Stop x $100) = 0.05 Lots (5 Micro Lots)
(If Gold drops $10.00, your 0.05 lot loses exactly $50).
Leverage Restrictions and Execution Rules
The low margin requirements offered by brokers often tempt traders to utilise high financial leverage. A critical mistake is confusing Required Margin (collateral locked to open a position) with Maximum Permissible Loss (calculated risk defined by your Stop Loss).
Worked Example: Trading 1.00 Standard Lot of XAU/USD at $2,000 Spot Price
- Position Size: 1.00 Standard Lot
- Gold Spot Price: $2,000
- Total Position Notional Value: $200,000
| Leverage Ratio | Required Margin (Collateral Locked) | Available Free Margin ($10k Account) | Risk Management Assessment |
|---|---|---|---|
| 10:1 | $20,000 | Insufficient Capital | Conservative baseline / High collateral required |
| 50:1 | $4,000 | $6,000 | Standard operational leverage for intraday setups |
| 100:1 | $2,000 | $8,000 | Low margin requirement / High risk of over-leveraging |
Key Takeaway: Higher leverage reduces required margin, freeing up usable free margin in your platform. However, leverage does not alter dollar risk. A $5 move against 1.00 Standard Lot equals a $500 loss, regardless of whether leverage is 10:1 or 100:1. Your Stop Loss determines your risk; leverage only determines your collateral buffer.
Baseline News Execution Policy: The 30/30 Rule
Executing trades around major macroeconomic releases (such as CPI, NFP, or FOMC decisions) requires a strict timing framework:
Baseline Policy (The 30/30 Rule): Traders may consider avoiding new market or pending orders from 30 minutes before a high-impact release until 30 minutes after. This buffer protects your equity from spread expansion, liquidity voids, and violent slippage.
Active Trader Exception (ECN Accounts): Experienced intraday traders operating with raw ECN (Electronic Communication Network) accounts, which route orders directly to institutional liquidity providers with near-zero spreads and raw market execution, may reduce this buffer window to 15 minutes before and after. However, for standard retail accounts where spreads widen significantly during news events, maintain the standard 30-minute buffer.
Structural Stop Loss Frameworks and Return Asymmetry
Protecting capital requires defining stop loss protocols at three distinct operational levels to prevent emotional decision making following adverse execution sequences:
- Per-Trade Stop Loss: Hard stop loss placed directly in the execution platform upon order entry, strictly capped at 0.5% to 1.0% of net equity.
- Daily Stop Loss Limit: Cap total portfolio loss at 2.0% to 3.0% per day. Reaching this limit requires closing all active positions and stopping trading for the remainder of the session.
- Weekly Stop Loss Limit: Cap total weekly portfolio drawdown at 5.0% to 6.0%. Hitting this limit requires stepping away from live execution to audit trading logs.
Maintaining a positive Risk-to-Reward Ratio (RRR) alongside these stop loss protocols ensures long-term statistical expectancy:
| Target RRR | Required Win Rate to Break Even | Profitability Outlook at 45% Win Rate |
|---|---|---|
| 1:1 | 50.0% | Negative theoretical expectancy |
| 1:2 | 33.3% | Positive theoretical expectancy |
| 1:3 | 25.0% | Positive theoretical expectancy |
These calculations are illustrative only and exclude spreads, commissions, slippage, financing charges and other trading costs. They do not guarantee profitability.
Intermarket Correlation Mechanics
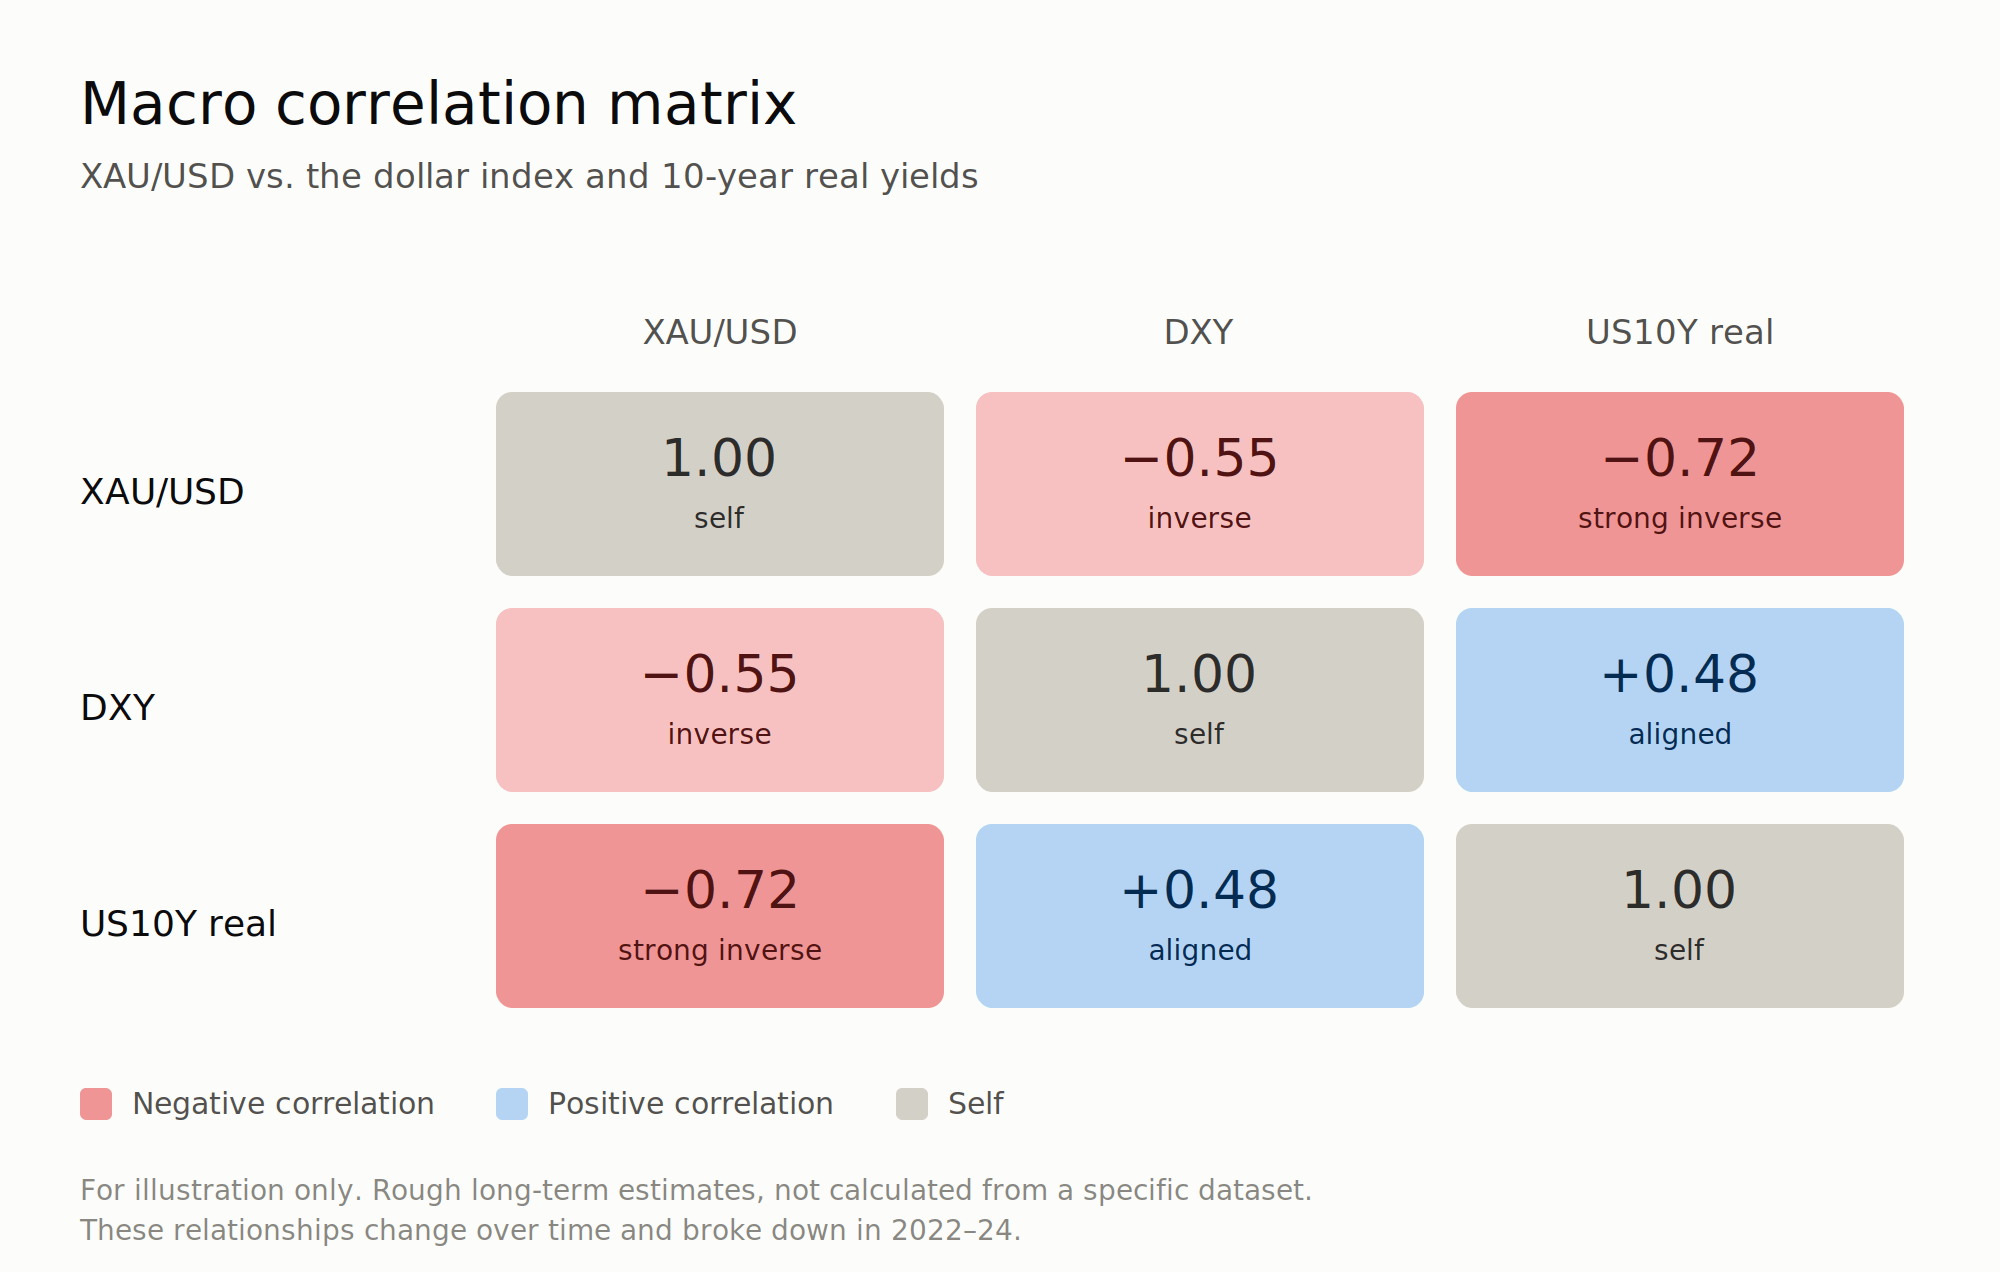
Gold does not move in a vacuum. Because XAU/USD functions as a global liquidity gauge and currency hedge, institutional traders evaluate intermarket relationships to filter out fake breakouts and validate true macro moves. Paying attention to two core benchmark indicators helps prevent entering trades against prevailing institutional flows:
- U.S. Dollar Index (DXY): Historically, Gold maintains a strong inverse correlation with the U.S. Dollar. When the DXY breaks key technical support, XAU/USD typically receives a strong bullish tailwind. Conversely, aggressive USD rallies often cap Gold’s upside momentum.
- 10-Year Treasury Yields (US10Y) & Real Interest Rates: Gold is a non-yielding asset. When real interest rates (nominal yield minus inflation) rise, holding physical gold carries a higher opportunity cost, creating selling pressure. When real yields fall or drop into negative territory, capital flows rapidly back into Gold.
Executing high-lot trades in Gold without cross-referencing DXY and US10Y momentum often results in entering long positions directly into macro resistance levels.
Pre-Trade Checklist and Execution Pitfalls
Executing trades in XAU/USD requires strict operational discipline before any position is opened. Rather than relying on intuition under market pressure, disciplined risk management frameworks enforce a systematic pre-entry protocol. Every order must meet key parameters: overall capital risk must be strictly capped at 1% or less of net equity (reducing to 0.5% during high-ATR regimes), and lot size must be dynamically derived from exact stop loss pip distance rather than estimated. Furthermore, orders should never be placed within 30 minutes of high-impact macroeconomic releases such as CPI, NFP, or FOMC rate decisions (adhering to the 30/30 Rule).
Before sending an order to the market, ensure a hard stop loss is programmed directly into the platform, a minimum Risk-to-Reward Ratio of 1:2 is structurally valid, and cumulative daily drawdown has not breached your 2.5% daily stop loss cap.
Failing to maintain this routine leads directly to the primary pitfalls that liquidate gold trading accounts. The most destructive errors include revenge trading using Martingale sizing after a loss, widening stop losses as price approaches your exit, opening trades during market session transitions when spreads widen drastically, and expecting Gold to respect tight 10-pip stop losses during active New York trading hours.
Final Thoughts
Surviving and thriving in Gold trading does not require predicting every market move. Capital growth in XAU/USD is achieved by implementing strict mathematical risk parameters that insulate your account against adverse market behaviour. By calculating percentage-based position sizes, scaling lot allocations according to market volatility, applying ATR-buffered stop losses, and adhering strictly to daily stop loss limits, you turn market volatility from a destructive threat into a manageable, structural advantage.
Frequently Asked Questions
1. How much capital should I risk per Gold trade?
A disciplined benchmark is risking 0.5% to 1.0% of your total account equity per trade. Risking more than 2.0% per trade exposes your capital to severe drawdowns during unavoidable consecutive losing streaks.
2. Is Gold significantly more volatile than standard Forex pairs?
Yes. Gold regularly exhibits an Average Daily Range (ADR) between $25 and $45 (2,500 to 4,500 pips), which is vastly wider than major currency pairs like EUR/USD or USD/JPY. This high velocity demands wider technical stop loss buffers.
3. What is the minimum Risk-to-Reward Ratio I should target in Gold?
A minimum Risk-to-Reward Ratio of 1:2 is recommended. This ensures that your portfolio remains profitable over time even with a modest win rate of 35% to 45%, providing a deep statistical buffer during natural drawdowns.
4. How do I handle trading Gold around major economic news releases?
Avoid executing new market orders within 30 minutes before and after high-impact events like CPI, NFP, or FOMC announcements (the 30/30 Rule). During this window, order book liquidity thins drastically, creating severe slippage and spread expansion.
5. Why should I use the Average True Range (ATR) to set stop losses in XAU/USD?
Using a 14-period ATR can help you set your stop loss by adapting to changing market regimes. It prevents your position from getting stopped out prematurely by normal market noise during high-volatility periods, while keeping risk tight during calmer consolidation cycles.
Disclaimer: The content of this article is intended for informational purposes only and should not be considered professional advice.