
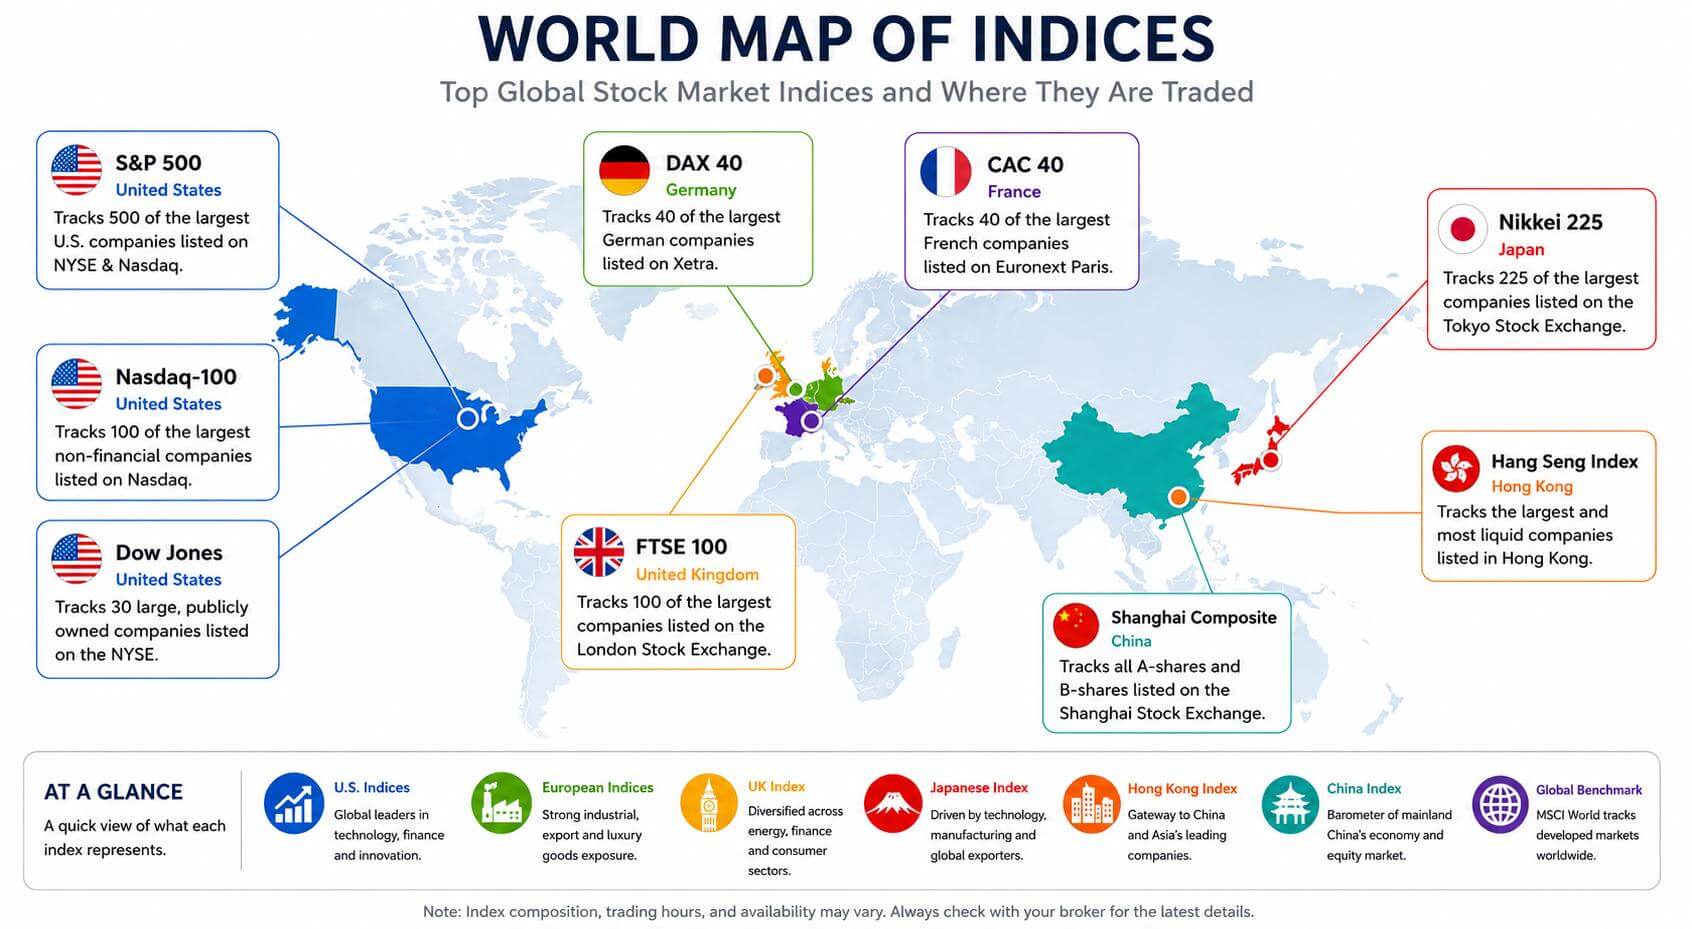
Choosing the right stock index can make a significant difference to your trading results. Some indices move hundreds of points every day, while others trend more steadily. Selecting an index that matches your trading style is just as important as choosing the right strategy.
Table of contents
-
- Which indices are best to trade in 2026?
- Quick comparison: best index by trader type
- What changed in the 2026 market backdrop?
- How should average movement and spreads be interpreted?
- Top 10 Indices to Trade
- Trading hours and product availability
- How does leverage change index-trading risk?
- Risk management tips for index traders
- Common index trading strategies
- How to choose the right index
Which indices are best to trade in 2026?
The best index depends on your trading style. The S&P 500 is generally the most accessible choice for beginners, the Nasdaq-100 is usually the strongest fit for active day traders, the FTSE 100 can suit swing traders seeking steadier multi-day moves, and the DAX 40 is a popular choice during the European session. The Dow Jones can appeal to traders who prefer a narrower, price-weighted blue-chip benchmark. Beyond these five, the Nikkei 225 and Hang Seng extend the trading day into the Asian session, the CAC 40 offers a different European sector mix to the DAX, and the Shanghai Composite and MSCI World Index are covered for context – both are useful benchmarks, though neither is commonly available as a direct retail CFD.
This guide compares each market by volatility, liquidity, trading hours, typical intraday movement, news sensitivity, product availability and risk. Hantec Markets offers index CFDs under instrument names that may vary by entity and platform. Product terms, spreads and leverage can change, so traders should check the live specification before opening a position.
Quick comparison: best index by trader type
| Index | Relative volatility | Liquidity | Best suited to | Most active session | News sensitivity |
|---|---|---|---|---|---|
| S&P 500 | Medium | Very high | Beginners; swing traders | US open and close | High |
| Nasdaq-100 | High to very high | Very high | Day traders; momentum traders | First two hours of US cash session | Very high |
| DAX 40 | High | High | European-session day traders | Frankfurt/Xetra open; London overlap | High |
| FTSE 100 | Low to medium | High | Swing traders; diversification | London open | Medium |
| Dow Jones | Medium | Very high | Beginners; trend traders | US open and close | Medium to high |
| Nikkei 225 | High to Very High | High | Asian-session traders; momentum traders | Tokyo open | Very high |
| Shanghai Composite | Low to Medium | Restricted (foreign access) | Macro-aware traders (via proxies, not direct) | Mainland China session | High (policy-driven) |
| CAC 40 | Medium to High | High | European-session traders; luxury/consumer-cyclical | Euronext Paris open | Medium to high |
| Hang Seng | High | High | Asian-session traders; China-linked exposure; range traders | Hong Kong morning session | High |
| MSCI World | Low (blended) | n/a – not a single tradable instrument | Benchmarking / sentiment gauge | US hours (approx. 70% US-weighted) | Medium (Fed-driven) |
What changed in the 2026 market backdrop?
Index trading in 2026 is being shaped by four linked themes: concentrated AI-related earnings, uneven inflation progress, changing interest-rate expectations and persistent geopolitical risk. These drivers can change correlations quickly, so a market that looks calm on a weekly chart may still produce sharp moves around data releases or company earnings.
AI investment and concentration
US benchmarks remain heavily influenced by large technology and semiconductor companies. That supports momentum when earnings and capital-expenditure guidance are strong, but it also increases the risk that a small group of stocks drives the whole index lower.
Inflation and interest rates
Inflation data and central-bank guidance remain major catalysts. CPI, PCE, wage data and policy meetings can reprice expectations for bond yields, which often affects growth-heavy indices more than value-heavy indices.
Geopolitics and energy
Conflict, tariffs, supply-chain disruption and energy-price shocks can affect indices differently. The FTSE 100 and DAX 40 are often more sensitive to commodity prices, currencies and international trade than a purely domestic reading would suggest.
Volatility is event-driven
Average daily ranges are useful for planning, but they are never fixed. Rather than relying on static point figures copied from previous months, traders should consistently recalculate the recent Average True Range (ATR) or daily percentage movement before sizing a position.
To gauge broader market stress, traders should monitor the CBOE Volatility Index (VIX). While a VIX reading in the mid-to-high teens typically reflects cautious optimism and baseline market calm, these conditions can shift rapidly. Volatility often spikes without warning in response to scheduled economic data releases, major earnings, or breaking geopolitical headlines, underscoring why risk management must remain adaptable.
How should average movement and spreads be interpreted?
Point ranges are not directly comparable across indices because each index has a different numerical level. A 150-point move in the DAX 40 is not equivalent to a 150-point move in the Nasdaq-100. For decision-making, compare the 14-day Average True Range as a percentage of the index level, then verify the live CFD spread during the session you plan to trade.
- Use the latest 14-day ATR or average daily percentage range as a planning input, not a forecast.
- Check the live bid-ask spread because it can widen outside the underlying cash session and around major news.
- Base stop distance and position size on current volatility, not a fixed number published in an article.
Top 10 Indices to Trade
1. S&P 500 (commonly US500 on CFD platforms) – US
Best overall for beginners and traders who want deep liquidity with broad US large-cap exposure.
What does this index track?
The S&P 500 is a float-adjusted market-capitalisation-weighted benchmark of leading US companies. S&P Dow Jones Indices describes it as a leading gauge of US large-cap equities. In mid-2026, information technology represented a large share of the index, so AI and semiconductor sentiment remain important even though the benchmark is broader than the Nasdaq-100.
Who is it best for?
Beginners, swing traders and macro traders.
| Trading factor | Practical guidance |
|---|---|
| Average movement | Typically ~65-90 points a day (about 0.9-1.2% of the index level), based on recent ATR; wider on CPI, payrolls or Fed days. |
| Typical spread | From 0.1 points on the Hantec Markets US500 CFD during liquid hours; verify the live spread outside core hours. |
| Best session | US cash-market open, the first two hours after the open, and the final hour before the close. |
| News sensitivity | Federal Reserve decisions, CPI/PCE, payrolls, Treasury yields and mega-cap earnings. |
| CFD availability | Commonly available as a CFD. Check the relevant Hantec Markets entity, symbol, hours and product disclosure. |
| Futures availability | Yes. US index futures are listed by CME Group; DAX futures are listed by Eurex; FTSE 100 futures are listed by ICE Futures Europe. |
Pros and cons
| Pros | Cons |
|---|---|
| Broad diversification compared with narrower indices. | Large technology weights can create concentration risk. |
| Deep cash, futures and CFD liquidity. | Can gap after overnight geopolitical or earnings news. |
| Abundant economic and earnings information. | Low-volatility periods can encourage excessive leverage. |
Risk-management note
Use percentage or ATR-based stops and reduce size before CPI, payrolls or Federal Reserve decisions.
2. Nasdaq-100 (commonly US100 on CFD platforms) – US
Best for experienced day traders seeking large intraday movement and strong momentum.
What does this index track?
The Nasdaq-100 contains 100 of the largest non-financial companies listed on Nasdaq. It is growth- and technology-heavy, which makes it especially sensitive to AI investment, semiconductor demand, bond yields and large-cap technology earnings.
Who is it best for?
Day traders, breakout traders and momentum traders with strict risk controls.
| Trading factor | Practical guidance |
|---|---|
| Average movement | Typically 120-180 points a day (about 0.5-0.7% of the index level) – the largest percentage and point movement among the five indices in this guide. |
| Typical spread | From 0.1 points on the Hantec Markets US100 CFD during liquid hours; spreads and slippage can widen around earnings and macro releases. |
| Best session | The first two hours of the US cash session; major technology earnings can also move futures outside cash hours. |
| News sensitivity | Semiconductor results, AI capital expenditure, technology regulation, real yields and Federal Reserve guidance. |
| CFD availability | Commonly available as a CFD. Check the relevant Hantec Markets entity, symbol, hours and product disclosure. |
| Futures availability | Yes. US index futures are listed by CME Group; DAX futures are listed by Eurex; FTSE 100 futures are listed by ICE Futures Europe. |
Pros and cons
| Pros | Cons |
|---|---|
| Strong intraday movement and clear momentum phases. | Sharp reversals and overnight gaps are common. |
| Deep futures and CFD liquidity. | High concentration in growth and technology shares. |
| Frequent catalysts from major technology companies. | Stops that are too tight are frequently hit during normal noise. |
Risk-management note
Risk less per point than on a slower index. Avoid carrying an oversized position through major technology earnings.
3. DAX 40 (commonly GER40 on CFD platforms) – Germany
Best for active traders who can trade the European morning and understand euro-area data.
What does this index track?
The DAX 40 tracks major German-listed companies and is closely watched as a benchmark for European industrial, financial and export exposure. It can react sharply to German data, European Central Bank policy, energy prices, China-linked demand and EUR moves.
Who is it best for?
European-session day traders and short-term swing traders.
| Trading factor | Practical guidance |
|---|---|
| Average movement | Typically 150-220 points a day (about 0.7-0.9% of the index level), often concentrated around the Frankfurt/Xetra open and major European or US data releases. |
| Typical spread | From 0.1 points on the Hantec Markets GER40 CFD in the main European session; potentially wider in quieter overnight periods. |
| Best session | The first two hours after the Xetra open and the overlap with London; US data can create a second volatility window. |
| News sensitivity | ECB decisions, German CPI, Ifo/ZEW surveys, euro-area PMIs, energy prices and China trade data. |
| CFD availability | Commonly available as a CFD. Check the relevant Hantec Markets entity, symbol, hours and product disclosure. |
| Futures availability | Yes. US index futures are listed by CME Group; DAX futures are listed by Eurex; FTSE 100 futures are listed by ICE Futures Europe. |
Pros and cons
| Pros | Cons |
|---|---|
| Strong European-session movement. | Sensitive to energy shocks and export demand. |
| Clear macro and session-based catalysts. | Can reverse sharply when US markets open. |
| Listed DAX futures are available on Eurex. | Currency and geopolitical headlines can complicate technical setups. |
Risk-management note
Do not size the position from the spread alone. Use current ATR and allow for a second volatility wave when US data or Wall Street opens.
4. FTSE 100 (commonly UK100 on CFD platforms) – UK
Best for swing traders and traders seeking less direct dependence on US technology.
What does this index track?
The FTSE 100 represents major companies listed on the London Stock Exchange. Many constituents earn substantial revenue outside the UK, while energy, mining, financial and defensive companies have a meaningful influence. As a result, oil, metals, sterling and global risk appetite can matter as much as domestic UK data.
Who is it best for?
Swing traders, relative-value traders and those seeking diversification from US technology exposure.
| Trading factor | Practical guidance |
|---|---|
| Average movement | Typically 80-120 points a day (about 0.8-1.1% of the index level) – usually lower than the Nasdaq-100 or DAX 40, although commodity and currency shocks can increase movement quickly. |
| Typical spread | From 0.1 points on the Hantec Markets UK100 CFD during London cash-market hours; verify the live quote before entry. |
| Best session | London open and periods around Bank of England decisions or major commodity moves. |
| News sensitivity | Bank of England policy, GBP, oil and metals, UK inflation and earnings from large banks, miners and energy companies. |
| CFD availability | Commonly available as a CFD. Check the relevant Hantec Markets entity, symbol, hours and product disclosure. |
| Futures availability | Yes. US index futures are listed by CME Group; DAX futures are listed by Eurex; FTSE 100 futures are listed by ICE Futures Europe. |
Pros and cons
| Pros | Cons |
|---|---|
| Different sector mix from US growth indices. | Lower movement may provide fewer intraday setups. |
| Can form steadier multi-day trends. | Currency effects can obscure the UK economic signal. |
| Strong links to commodities create diversification opportunities. | Large energy, mining and financial weights create sector concentration. |
Risk-management note
Check oil, metals and GBP before entry. A technically valid setup can fail when a large commodity or currency move changes the sector backdrop.
5. Dow Jones Industrial Average (commonly US30 on CFD platforms) – US
Best for traders who prefer a narrower blue-chip index with often steadier movement than the Nasdaq-100.
What does this index track?
The Dow Jones Industrial Average contains 30 prominent US companies and is price weighted rather than market-cap weighted. That structure means a high-priced constituent can have an outsized effect. It is widely followed, but it is less diversified than the S&P 500.
Who is it best for?
Beginners, trend traders and traders focused on US blue chips.
| Trading factor | Practical guidance |
|---|---|
| Average movement | Typically 350-500 points a day (about 0.7-1.0% of the index level) – moderate in percentage terms, though the Dow’s high index level can make the point movement look large. |
| Typical spread | From 0.1 points on the Hantec Markets US30 CFD during liquid hours; compare spread as a percentage of the index and in relation to your stop distance. |
| Best session | US cash-market open and close. |
| News sensitivity | US macro data, financial and industrial earnings, Treasury yields and broad risk sentiment. |
| CFD availability | Commonly available as a CFD. Check the relevant Hantec Markets entity, symbol, hours and product disclosure. |
| Futures availability | Yes. US index futures are listed by CME Group; DAX futures are listed by Eurex; FTSE 100 futures are listed by ICE Futures Europe. |
Pros and cons
| Pros | Cons |
|---|---|
| Deep futures and CFD liquidity. | Only 30 constituents. |
| Often less sensitive to one technology theme than the Nasdaq-100. | Price weighting can create unintuitive moves. |
| Can produce cleaner trend days after macro surprises. | A large point move may still be a modest percentage move. |
Risk-management note
Size by percentage volatility, not the number of Dow points. A 400-point stop can be smaller in percentage terms than a much lower point stop on another index.
6. Nikkei 225 (commonly JP225 on CFD platforms) – Japan
Best for traders wanting Asian-session exposure and comfortable with sharp, event-driven volatility.
What does this index track?
The Nikkei 225 tracks 225 leading companies listed on the Tokyo Stock Exchange, spanning autos, electronics, financials and semiconductor-linked manufacturers. It is Japan’s most widely followed benchmark and, in 2026, has become highly sensitive to the same AI and semiconductor themes driving the Nasdaq-100, alongside Bank of Japan policy and yen moves.
Who is it best for?
Asian-session traders, momentum traders comfortable with large swings, and those seeking diversification from US and European exposure.
| Trading factor | Practical guidance |
|---|---|
| Average movement | Highly volatile in 2026, with single-session moves of 1-3% common (roughly 650-1,900 points at current levels) around Bank of Japan meetings and major semiconductor earnings. |
| Typical spread | From 0.1 points on the Hantec Markets JP225 CFD during the Tokyo cash session; spreads widen outside these hours. |
| Best session | The Tokyo cash-market open (Japan Standard Time); the first hour typically carries the heaviest volume. |
| News sensitivity | Bank of Japan policy decisions, yen (JPY) moves, semiconductor and AI capital-expenditure headlines, and spillover from overnight US tech earnings. |
| CFD availability | Commonly available as a CFD. Check the relevant Hantec Markets entity, symbol, hours and product disclosure. |
| Futures availability | Yes. Nikkei 225 futures are listed on the Osaka Exchange (part of Japan Exchange Group) and on Singapore Exchange (SGX). |
Pros and cons
| Pros | Cons |
|---|---|
| Extends practical trading hours into the Asian session, bridging the gap between US close and European open. | Currency (JPY) policy shifts can amplify or offset index moves, complicating the picture for non-yen accounts. |
| Direct exposure to global semiconductor and AI supply-chain themes through Japanese manufacturers. | Bank of Japan surprises have produced some of the sharpest single-day moves of any major index in 2026. |
| Deep futures liquidity via JPX and SGX contracts. | Heavy correlation to global tech/semiconductor sentiment reduces true diversification benefit. |
Risk-management note
Size your positions on percentage volatility rather than points, and avoid holding through Bank of Japan meetings or major semiconductor earnings without adjusting size.
7. Shanghai Composite (China)
Best used as a macro gauge on China’s economy rather than a direct trading instrument, since it is not commonly offered as a retail CFD.
What does this index track?
The Shanghai Composite tracks all A-shares and B-shares listed on the Shanghai Stock Exchange, covering everything from state-owned enterprises to emerging technology firms. It is the most-watched barometer of mainland Chinese equities, though foreign retail access to the underlying market remains restricted by capital controls.
Who is it best for?
Macro-aware traders who want to understand China-linked sentiment, rather than beginners looking for a directly tradable instrument.
| Trading factor | Practical guidance |
|---|---|
| Average movement | Historically lower volatility than most indices in this guide, partly a function of trading bands and periodic state intervention; can move sharply on policy surprises. |
| Typical spread | Not typically offered as a standalone retail CFD, owing to capital controls on direct Shanghai-listed A-shares. Traders seeking mainland China exposure through Hantec Markets commonly use the China A50 index (tracking large-cap mainland companies listed in Shanghai and Shenzhen) or Hong Kong-listed China proxies instead. |
| Best session | Mainland China cash-market hours (Beijing time), with a midday break. |
| News sensitivity | People’s Bank of China policy, China GDP/PMI releases, property-sector stimulus, and US-China trade or tariff headlines. |
| CFD availability | Not commonly available as a direct CFD with most retail brokers, including Hantec Markets; the China A50 index is the typical practical proxy. |
| Futures availability | Onshore China index futures (e.g., CSI 300 futures on CFFEX) are restricted mainly to qualified domestic and institutional investors, not general retail access. |
Pros and cons
| Pros | Cons |
|---|---|
| Provides a direct read on the world’s second-largest economy and its domestic equity market. | Foreign retail access to the underlying market is restricted by capital controls, so it is not directly tradable as a CFD for most Hantec Markets clients. |
| Can offer diversification from Western-market-driven sentiment during periods when China and US cycles diverge. | Subject to periodic state intervention (trading halts, index-support buying) that can distort normal price discovery. |
| Useful context for related trades (commodities, AUD, Hong Kong and China-exposed European stocks). | Limited transparency around policy timing increases headline and gap risk for anyone trading proxies. |
Risk-management note
Since most practical exposure comes through a proxy like China A50 rather than the Shanghai Composite itself, base position sizing and stops on that proxy’s own volatility, not the headline Shanghai Composite number.
8. CAC 40 (commonly FR40 on CFD platforms) – France
Best for European-session traders who want exposure to France’s luxury, energy and industrial giants alongside the DAX 40.
What does this index track?
The CAC 40 tracks the 40 largest companies listed on Euronext Paris, with heavy weightings in luxury goods, energy, banking and industrials. It offers a different sector mix to the DAX 40 – most notably a large luxury-goods weighting that makes it sensitive to Chinese consumer demand – while still responding to the same broad eurozone drivers.
Who is it best for?
European-session day traders and swing traders wanting diversification from Germany-only exposure, particularly those tracking luxury and consumer-cyclical themes.
| Trading factor | Practical guidance |
|---|---|
| Average movement | Typically 100-160 points a day (about 1.2-1.9% of the index level), broadly comparable to the DAX 40 but slightly less volatile on average. |
| Typical spread | From 0.1 points on the Hantec Markets FR40 CFD during the main European session; potentially wider overnight. |
| Best session | The Euronext Paris open, overlapping with the Frankfurt and London sessions. |
| News sensitivity | European Central Bank decisions, French political and fiscal headlines (budget votes, government confidence votes), eurozone PMI data, and Chinese consumer-demand signals for the luxury sector. |
| CFD availability | Commonly available as a CFD. Check the relevant Hantec Markets entity, symbol, hours and product disclosure. |
| Futures availability | Yes. CAC 40 futures are listed on Euronext. |
Pros and cons
| Pros | Cons |
|---|---|
| Exposure to Europe’s second-largest economy and its luxury, energy and industrial leaders. | French political instability (frequent budget and confidence-vote headlines) can create gap risk with little warning. |
| Meaningful sector diversification from the DAX 40’s industrial/export weighting. | Heavy luxury-sector weighting makes it unusually sensitive to Chinese consumer demand, an indirect and sometimes overlooked risk factor. |
| Solid liquidity during the European session with tight spreads. | Generally thinner liquidity than the DAX 40 or FTSE 100 outside core European hours. |
Risk-management note
Watch French political headlines (budget votes, confidence votes, credit-rating commentary) as closely as economic data – these have produced some of the sharpest gaps in the index in 2026. Widen stops around scheduled political events.
9. Hang Seng (commonly HK50 on CFD platforms) – Hong Kong
Best for traders wanting liquid, active-session exposure to Hong Kong and mainland China-linked technology and property names.
What does this index track?
The Hang Seng Index tracks the largest and most liquid companies listed on the Hong Kong Stock Exchange, with heavy weightings in technology, financials, property and insurance. It acts as the main liquid gateway for foreign traders seeking China-linked exposure, since direct mainland access (Shanghai Composite) is restricted.
Who is it best for?
Asian-session traders, range traders (given its historically choppy price action), and anyone seeking practical China-linked exposure that is actually tradable as a CFD.
| Trading factor | Practical guidance |
|---|---|
| Average movement | Typically 300-500 points a day (about 1.2-2.0% of the index level), with sharper moves around Chinese policy announcements. |
| Typical spread | From 4.5 points on the Hantec Markets HK50 CFD during the Hong Kong session; the index has a midday trading break that can affect liquidity. |
| Best session | The Hong Kong cash-market session, split into a morning and afternoon segment around a midday break; the morning open typically sees the heaviest volume. |
| News sensitivity | Chinese stimulus and regulatory headlines, mainland technology-sector policy, Hong Kong property-market conditions, and US-China relations. |
| CFD availability | Commonly available as a CFD. Check the relevant Hantec Markets entity, symbol, hours and product disclosure. |
| Futures availability | Yes. Hang Seng Index futures are listed on Hong Kong Exchanges and Clearing (HKEX). |
Pros and cons
| Pros | Cons |
|---|---|
| The most liquid, directly tradable gateway to China-linked technology and property exposure. | Highly sensitive to Beijing policy and regulatory headlines, which can move the index sharply with little notice. |
| Active session bridges the gap between Asian and European trading days. | Historically range-bound and choppy rather than trending, which can frustrate trend-following strategies. |
| Meaningful diversification from Western-market-driven sentiment. | The midday trading break can thin liquidity and widen spreads around the reopen. |
Risk-management note
Reduce size or widen stops around the midday break and ahead of major Mainland China data or policy announcements, when liquidity can thin and volatility can spike without warning.
10. MSCI World Index (Global benchmark) – Global
Best used as a global sentiment benchmark rather than a directly tradable instrument, since it is not offered as a retail index CFD.
What does this index track?
The MSCI World Index tracks large- and mid-cap companies across developed markets, covering roughly 85% of the free-float market capitalisation in each constituent country. With over 1,300 constituents and around a 70% weighting to US equities (led by the same mega-cap technology names that dominate the S&P 500 and Nasdaq-100), it is the standard benchmark for “how are developed-market equities doing” at a glance.
Who is it best for?
Traders and investors who want a single reference point for global developed-market sentiment, rather than a specific position to trade.
| Trading factor | Practical guidance |
|---|---|
| Average movement | Lower daily volatility than any single index in this guide, since it blends thousands of constituents across multiple countries and currencies. |
| Typical spread | Not typically offered as a standalone leveraged CFD by Hantec Markets or most retail brokers. Global developed-market exposure is usually accessed through ETFs (for example, iShares Core MSCI World UCITS ETF) rather than a point-based index CFD. |
| Best session | Not applicable directly; because roughly 70% of the index is US-weighted, it is most responsive to US trading hours and Federal Reserve-related headlines. |
| News sensitivity | Global central bank policy (the Federal Reserve dominates given the US weighting), global growth data, and mega-cap technology earnings. |
| CFD availability | Not commonly available as a direct CFD. Traders wanting similar diversified exposure through Hantec Markets typically combine several individual indices in this guide (for example US500, GER40, UK100 and JP225) rather than trade MSCI World directly. |
| Futures availability | No standardised retail futures contract; institutional exposure is typically achieved through total-return swaps or index funds rather than exchange-listed futures. |
Pros and cons
| Pros | Cons |
|---|---|
| The broadest developed-market diversification of any index in this guide, spanning around 15 countries. | Not directly tradable as a CFD with Hantec Markets or virtually any retail broker. |
| A useful single benchmark for gauging overall global equity sentiment. | Heavily skewed toward the same US mega-cap technology names that dominate the S&P 500 and Nasdaq-100, so its real diversification benefit is more limited than the name suggests. |
| Lower single-country or single-sector concentration risk than any individual index covered here. | No dedicated retail-sized futures market, unlike every other index in this guide. |
Risk-management note
Since it isn’t directly tradable, use MSCI World as a sentiment check: if it is diverging sharply from the S&P 500 (for example, ex-US developed markets outperforming), that can flag better relative-value opportunities in the regional indices covered elsewhere in this guide (GER40, UK100, JP225) than staying purely US-focused.
Trading hours and product availability
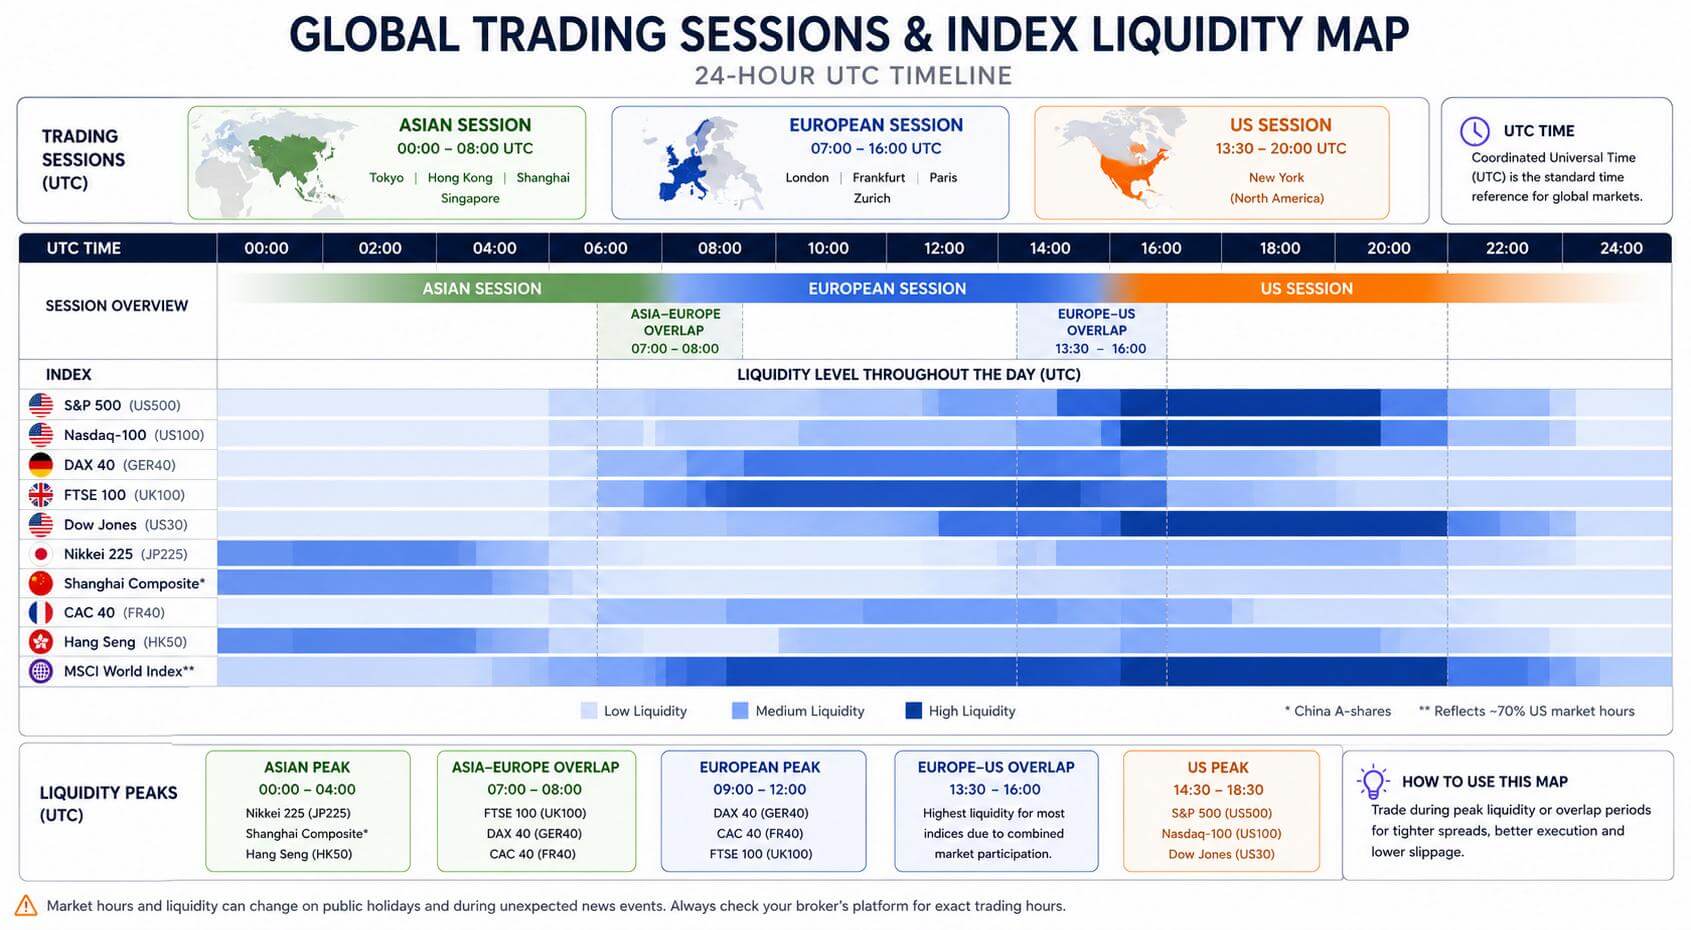
The cash index, the exchange-traded futures contract and a broker’s CFD are different products. Their hours, financing, expiry, margin and price formation can differ. The table below shows the main cash-session reference; Hantec Markets CFD hours should be checked in the live platform because holiday schedules and entity-specific specifications can change.
| Index | Underlying cash session | Best practical window | Listed futures |
|---|---|---|---|
| S&P 500 | 09:30-16:00 New York time | 09:30-11:30 and final hour | E-mini and Micro E-mini S&P 500 (CME) |
| Nasdaq-100 | 09:30-16:00 New York time | 09:30-11:30; major tech earnings | E-mini and Micro E-mini Nasdaq-100 (CME) |
| DAX 40 | 09:00-17:30 Central European time (Xetra) | 09:00-11:00; US-data overlap | DAX and Mini/Micro-DAX (Eurex) |
| FTSE 100 | 08:00-16:30 London time | 08:00-10:00; UK data/BoE | FTSE 100 futures (ICE Futures Europe) |
| Dow Jones | 09:30-16:00 New York time | 09:30-11:30 and final hour | E-mini and Micro E-mini Dow (CBOT/CME Group) |
| Nikkei 225 | 09:00-15:00 Japan Standard Time (Tokyo Stock Exchange) | First hour after Tokyo open | Nikkei 225 futures (Osaka Exchange, SGX) |
| Shanghai Composite | 09:30-15:00 China Standard Time (Shanghai Stock Exchange, midday break) | Not directly tradable as a CFD; China A50 proxy hours apply instead | Onshore CSI 300 futures (CFFEX, restricted access) |
| CAC 40 | 09:00-17:30 Central European Time (Euronext Paris) | Paris open; overlap with Frankfurt/London | CAC 40 futures (Euronext) |
| Hang Seng | 09:30-12:00 and 13:00-16:00 Hong Kong Time (split session) | Morning open | Hang Seng Index futures (HKEX) |
| MSCI World | n/a – not a single exchange-traded instrument | Most responsive during US hours (70% US weighting) | No standard retail futures contract |
How does leverage change index-trading risk?
Leverage reduces the cash required to open a position, but it does not reduce the market exposure. A small percentage move in the index can therefore create a much larger percentage gain or loss on the deposited margin. Retail leverage limits and margin requirements depend on the client’s jurisdiction, regulatory entity and product.
- Treat the stop-loss distance and value per point as the core position-sizing inputs.
- Leave spare margin for spread widening, overnight gaps and temporary adverse movement.
- Do not assume the maximum available leverage is an appropriate position size.
- Check overnight financing for cash CFDs and expiry/roll mechanics for futures or futures-based CFDs.
Risk management tips for index traders
Set risk before entry
Define the maximum account loss, stop distance and position size before placing the trade.
Use a volatility-adjusted stop
A stop should reflect recent market movement and the trade thesis. Wider volatility requires a smaller position.
Avoid correlated overexposure
Long positions in the S&P 500, Nasdaq-100 and Dow can represent one large US-equity bet rather than three independent trades.
Plan for scheduled news
Reduce exposure or wait until spreads stabilise around CPI, payrolls, central-bank decisions and major earnings.
Use a daily loss limit
Stop trading after a predefined daily loss or a set number of rule-breaking trades.
Review gap risk
A stop order may fill beyond the requested level when the market gaps. Position size should account for that possibility.
Common index trading strategies
The strategy should match the index, session and volatility regime. The links below use related Hantec Markets educational articles wherever an internal guide is available.
Trend trading: Follow a sequence of higher highs and higher lows, or lower highs and lower lows. This can suit the S&P 500, Dow and DAX when a macro theme is persistent. Read the detailed guide
Day trading and momentum: Trade opening-range breaks, intraday continuation or momentum after a catalyst. This is commonly used on the Nasdaq-100 and DAX. Read the detailed guide
Swing trading: Hold for several sessions using daily support, resistance and trend structure. This can suit the FTSE 100 and S&P 500. Read the detailed guide
Range trading: Buy near established support and sell near resistance when the index lacks a directional catalyst. Avoid forcing this approach on a breakout day. Read the detailed guide
News trading: Trade the reaction to scheduled data rather than guessing the number. Wait for liquidity and spreads to normalise when execution risk is high. Read the detailed guide
How to choose the right index
| Your priority | Index to consider | Reason |
|---|---|---|
| Beginner-friendly structure | S&P 500 or Dow | Deep liquidity, extensive information and usually lower percentage volatility than the Nasdaq-100. |
| Intraday volatility | Nasdaq-100 | Large, frequent moves around technology, yields and AI-related catalysts. |
| European morning trading | DAX 40 | Strong liquidity and event flow during the European session. |
| Swing trading and diversification | FTSE 100 | Different sector mix and often steadier multi-day movement. |
| Broad US macro exposure | S&P 500 | Wider constituent base than the Nasdaq-100 or Dow. |
| Asian-session trading | Nikkei 225 or Hang Seng | Active, liquid sessions during Asian hours with strong intraday movement |
| China-linked exposure (directly tradable) | Hang Seng | Liquid CFD/futures gateway to China-linked technology and property names |
| Global benchmark / sentiment gauge | MSCI World | Broadest developed-market diversification; useful context rather than a trade |
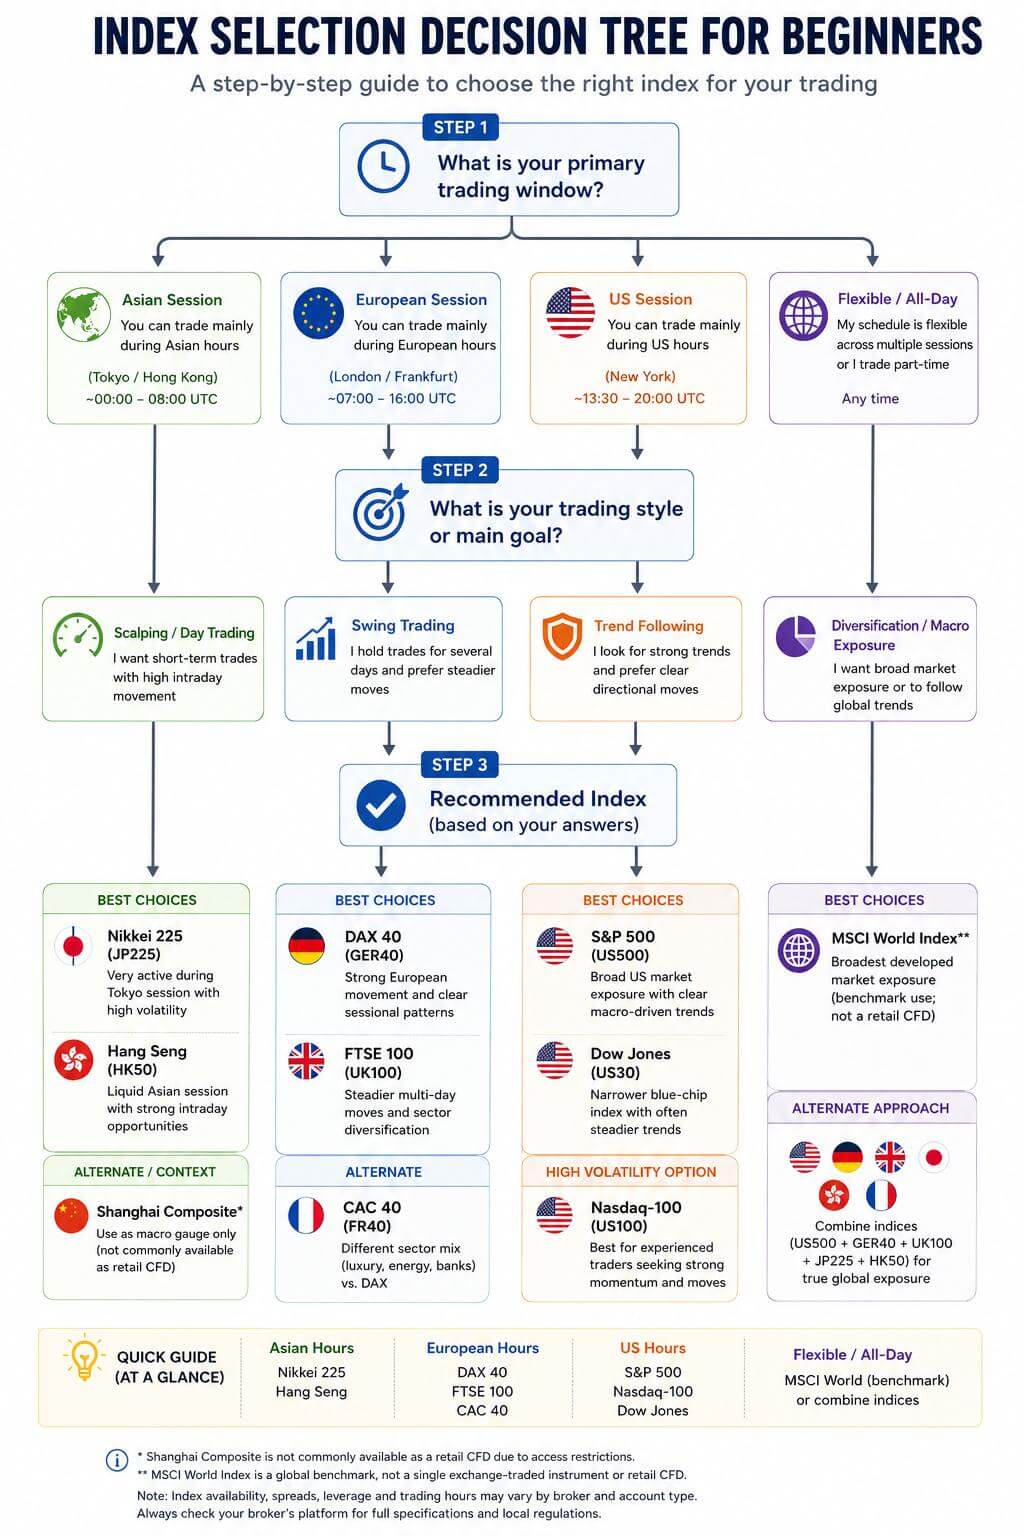
Visual Guide: How to Choose Your First Index (Decision Tree)
Frequently asked questions
Which index is best for beginners?
The S&P 500 is often the best starting point because it combines broad diversification, deep liquidity and extensive market information. The Dow can also be suitable, but its price-weighted construction is less intuitive.
Which index is best for day trading?
The Nasdaq-100 is often preferred by experienced day traders because it tends to have strong intraday movement and frequent catalysts. The DAX 40 is a strong alternative for traders active in the European morning.
Which index is the most volatile?
Among the ten indices covered here, the Nikkei 225 has shown the largest swings in 2026, with sharp semiconductor-driven moves in both directions, closely followed by the Nasdaq-100. The DAX 40 and Hang Seng can also be extremely active around European and Chinese policy events respectively. Volatility changes, so compare recent ATR percentages before trading.
Which index is best for swing trading?
The FTSE 100 and S&P 500 are common swing-trading choices. The FTSE offers a different sector mix, while the S&P 500 provides deeper global liquidity and broad US exposure.
Are indices available as CFDs and futures?
Most of the indices covered here are commonly available as CFDs, and exchange-traded futures exist for the majority of them. The Shanghai Composite and MSCI World Index are the exceptions – neither is typically offered as a direct retail CFD or futures contract, so they are covered mainly for market context. CFDs and futures have different financing, expiry, margin and execution characteristics.
What is the best time to trade an index?
The most liquid period is usually when the underlying cash market is open, especially the first one to two hours. Major data releases can create additional opportunity but also higher spread and slippage risk.
Which index is best for Asian-session trading?
The Nikkei 225 and Hang Seng are the two indices in this guide most active during Asian hours. The Nikkei 225 offers direct exposure to Japan and global semiconductor themes, while the Hang Seng provides a liquid, directly tradable gateway to China-linked technology and property names.
Is the Shanghai Composite tradable as a CFD?
Not typically. Capital controls restrict foreign retail access to mainland Chinese A-shares, so most brokers, including Hantec Markets, do not offer it as a direct CFD. Traders wanting China-linked exposure commonly use the China A50 index or Hong Kong-listed proxies such as the Hang Seng instead.
Is the MSCI World Index tradable as a CFD?
No. The MSCI World Index is a broad, multi-country benchmark rather than a single exchange-traded instrument, so it is not offered as a retail index CFD. It is more commonly accessed through ETFs, or approximated by combining several of the individual indices in this guide.
Key takeaways
- Choose an index by percentage volatility, session and news sensitivity rather than by its point value.
- The S&P 500 is the strongest all-round choice for many beginners; the Nasdaq-100 is better suited to experienced day traders.
- The DAX 40 is most active in the European session, while the FTSE 100 can provide sector diversification and swing-trading opportunities.
- Check Hantec Markets index trading conditions for current spreads, hours, margin and leverage before trading.
- Use volatility-adjusted position sizing and account for correlation, gaps and scheduled news.
- The Nikkei 225 and Hang Seng extend the trading day into the Asian session; the Shanghai Composite and MSCI World Index are covered for market context rather than direct trading, since neither is commonly available as a retail CFD.
Sources and methodology
Market data and analytics providers used for live index levels, volatility and technical calculations:
- Bloomberg – Real-time index levels, 52-week ranges and market-moving news context
- TradingView – Live charting, historical price data and ATR/technical indicator calculations
Official provider and exchange sources used only for primary market facts:
- S&P Dow Jones Indices – S&P 500 overview, composition and current data
- S&P Dow Jones Indices – Dow Jones Industrial Average
- Nasdaq – Nasdaq-100 official index overview
- LSEG / FTSE Russell – FTSE 100 official index page
- CME Group – US equity index futures
- Eurex – DAX derivatives
- ICE – FTSE index derivatives
Disclaimer: The content of this article is intended for informational purposes only and should not be considered professional advice.
Disclaimer: The content of this article is intended for informational purposes only and should not be considered professional advice.