
Between 80% and 95% of retail traders lose money within their first year. That statistic is not meant to discourage you. It highlights a simple reality: most traders approach markets without structure, discipline, or a clearly defined risk framework.
The small percentage who succeeds do not rely on luck or secret indicators. They rely on repeatable systems and strict risk management.
In 2026, financial markets move faster than ever. Algorithmic execution dominates liquidity, macroeconomic news is priced in within seconds, and volatility can expand rapidly. While day trading requires speed and constant attention, trend trading focuses on patience and structured execution.
Instead of trying to predict every market movement, trend traders aim to capture the core directional move of the market. Success in modern trading is not about prediction. It is about discipline, risk control, and alignment with momentum.
Key Takeaways
The article focuses on several critical areas of trend trading:
- The 90% Rule: Addresses why between 80% and 95% of retail traders lose money within their first year and how approaching markets with structure prevents these losses.
- Identification Methods: Details on using Price Action through Higher Highs (HH) and Higher Lows (HL), Moving Averages like the 50 and 200 EMA, and the ADX indicator to measure trend strength.
- Risk Framework: Explains the 1–2% Rule for account protection and the professional importance of maintaining at least a 1:2 risk-to-reward ratio.
- Market Context: Specifically why high liquidity, 24-hour operations, and macroeconomic drivers make the Forex market ideal for trend-based strategies.
What Is Trend Trading in Forex? (Simple Explanation for Beginners)
Trend trading strategy is a method of trading where traders identify the market direction (uptrend or downtrend) and enter trades that follow that momentum using pullbacks, confirmation signals, and strict risk management.
Trend Trading Strategy (Quick Steps):
- Identify the trend (higher highs/lows or moving averages)
- Wait for a pullback
- Confirm entry (candlestick + indicator)
- Set stop loss (based on structure)
- Target 1:2+ risk-reward
In simple terms: Trade with the market, not against it.
Markets tend to move in directional phases driven by macroeconomic forces, institutional positioning, and changes in global sentiment. Trend traders focus on capturing the middle portion of these moves, rather than attempting to pick exact tops or bottoms.
This strategy differs from other trading styles:
| Strategy | Core Idea | Risk Profile |
|---|---|---|
| Trend Trading | Follow directional momentum | Moderate |
| Range Trading | Buy support and sell resistance | Moderate |
| Counter-Trend Trading | Attempt to catch reversals | High |
| Scalping | Capture small intraday moves | Very high activity |
Trend trading sacrifices perfect entries in exchange for higher probability and clearer market structure.
Why Forex Markets Are Ideal for Trend Trading
The foreign exchange market is particularly well suited to trend-based strategies due to its structural characteristics.
24-Hour Market
Forex operates continuously throughout the week. This allows directional moves to develop without the overnight gaps often seen in equity markets.
High Liquidity
Major currency pairs such as EUR/USD, GBP/USD, and USD/JPY benefit from enormous liquidity. Institutional participation creates smoother price movement and cleaner trends.
Strong Macro Drivers
Currencies move primarily due to macroeconomic forces such as: interest rates, central bank policy, inflation expectations, and geopolitical developments. These drivers can create sustained trends lasting weeks or even months.
Efficient Price Discovery
The immense trading volume in the forex market allows traders to enter and exit positions efficiently with minimal slippage compared with smaller markets.
How to Identify a Trend in Forex (3 Reliable Methods)
Before entering any trade, traders must determine whether the market is actually trending. Below are three commonly used methods.
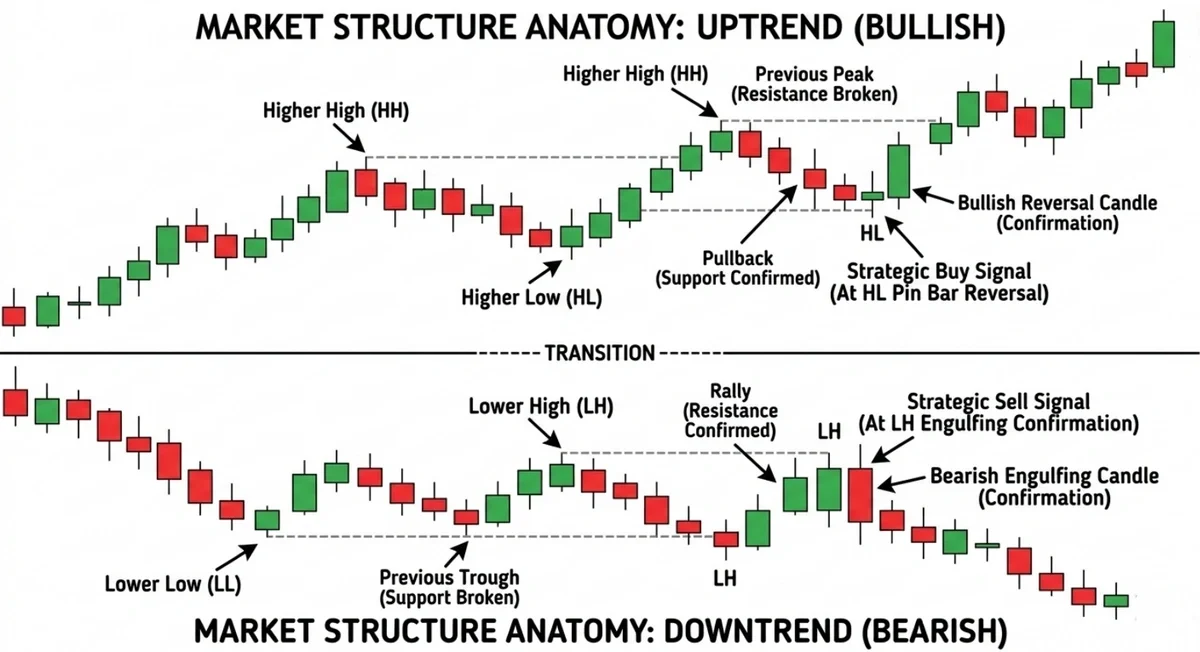
Price Action and Market Structure
The most fundamental method is analysing price structure.
An uptrend forms when price creates:
Higher Highs (HH)
Higher Lows (HL)
Example of an uptrend structure:
Higher High
↑
Pullback
↓
Higher Low
↑
Continuation
A downtrend forms when price creates:
Lower Lows (LL)
Lower Highs (LH)
Example of a downtrend structure:
Lower Low
↓
Pullback
↑
Lower High
↓
Continuation
As long as price continues to respect this structure, the trend remains intact.
Moving Averages (Trend Filter)
Moving averages smooth price fluctuations and reveal the broader market direction.
Two of the most widely used indicators are:
50 EMA
Used to identify the medium-term trend.
200 EMA
Used to determine the long-term trend.
A well-known signal occurs when:
- the 50 EMA crosses above the 200 EMA (Golden Cross), suggesting bullish momentum
- the 50 EMA crosses below the 200 EMA (Death Cross), indicating bearish momentum
Traders also watch the slope of the moving average. A steep slope suggests strong directional momentum.
ADX (Average Directional Index)
The ADX indicator measures trend strength, regardless of direction.
| ADX Value | Interpretation |
|---|---|
| Below 20 | Weak or ranging market |
| 20–25 | Emerging trend |
| Above 25 | Strong trend |
The indicator also includes directional lines:
+DI → bullish pressure
-DI → bearish pressure
When ADX rises above 25, the market often enters a strong trending phase.
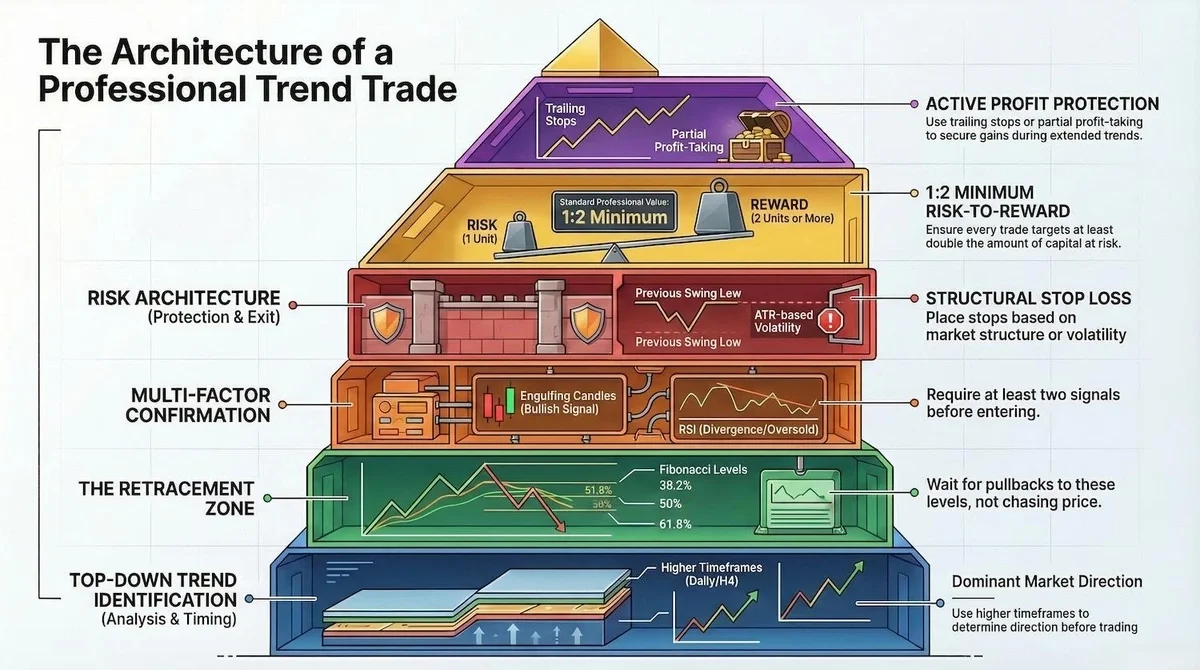
The Core Trend Trading Strategy (Step-by-Step)
A structured trading process improves consistency and discipline. The best trend trading strategy involves identifying the trend on a higher timeframe, waiting for a pullback, confirming the entry with price action or indicators, placing a stop loss based on structure, and targeting at least a 1:2 risk-to-reward ratio.
Step 1: Identify the Higher Timeframe Trend
Start with a higher timeframe such as Daily or H4 to determine the dominant direction. This approach is called top-down analysis.
Daily chart → determines trend
H1 chart → used for entry timing
Trading against the higher timeframe trend increases risk.
Step 2: Wait for a Pullback
Professional traders rarely chase price. Instead, they wait for retracements toward support or resistance levels.
Common retracement zones include Fibonacci levels:
38.2%
50%
61.8%
Moving averages such as the 20 EMA or 50 EMA often act as dynamic support during trends.
Step 3: Look for Entry Confirmation
Common confirmation patterns include
- bullish or bearish engulfing candles
- pin bars showing rejection
- inside bars indicating consolidation
Momentum indicators like RSI or MACD can provide additional confirmation.
Many professionals follow a two-factor rule, meaning they require at least two signals before entering a trade.
Step 4: Place a Strategic Stop Loss
Stop losses should be based on market structure, not arbitrary pip distances.
Examples:
Long trade → stop below the recent swing low
Short trade → stop above the recent swing high
Some traders also use ATR (Average True Range) to adjust stops based on market volatility.
Hard stop orders should always be placed immediately after entering a trade.
Step 5: Set Targets and Manage the Trade
Every trade should have a predefined reward target.
A common professional rule is:
Minimum risk-to-reward ratio = 1:2
Example:
Risk: 50 pips
Target: 100 pips
Traders may also use trailing stops to stay in extended trends while protecting profits.
Another approach is partial profit taking, where part of the position is closed at the first target while the remaining portion rides the trend.
Best Timeframes for Trend Trading
Different traders prefer different trading horizons.
| Timeframe | Type of Trader | Typical Trend Duration |
|---|---|---|
| Weekly / Daily | Swing or position trader | Weeks to months |
| H4 | Swing trader | Days to weeks |
| H1 | Intraday swing trader | Hours to days |
| M15 and below | Not recommended | High market noise |
Lower timeframes often contain more randomness and produce false signals.
Best Indicators for Trend Trading
Indicators should confirm price action rather than replace it.
Moving Averages
Provide a baseline trend direction and identify dynamic support or resistance.
MACD
Measures momentum behind price movement.
RSI
Helps identify divergence and momentum shifts.
Provide volatility context and highlight strong momentum when price moves along the outer band.
Combining two or three indicators is often more effective than relying on a single signal.
Risk Management Rules Every Trend Trader Must Follow
No trading strategy can succeed without disciplined risk management.
The 1–2% Rule
Professional traders rarely risk more than 1–2% of their account on a single trade.
Example:
Account balance: $10,000
Risk per trade: 1%
Maximum loss: $100
This protects capital during inevitable losing streaks.
Position Sizing Formula
Position sizing removes emotion from trading decisions.
Position Size = Account Risk ÷ Stop Loss Distance
Example:
Account risk = $100
Stop loss = 50 pips
Position Size = $100 ÷ 50 pips
Position Size = $2 per pip
Correlation Risk
Some currency pairs move together.
For example:
EUR/USD
GBP/USD
Opening trades in both pairs in the same direction effectively doubles risk exposure.
Drawdown Limits
Professional traders define maximum daily or weekly loss limits.
If the limit is reached, trading stops until the next session.
Real-World Examples: Trend Trades That Paid Off
To understand how theory translates into profit, let’s analyse two classic trend setups using the “two-factor rule” for confirmation.
Example 1: The EUR/USD Daily Bull Run (Macro Trend)
In this scenario, the market moved from a ranging phase into a sustained uptrend driven by shifting central bank policies.
- The Setup: The Daily chart showed a “Golden Cross,” where the 50 EMA rose above the 200 EMA.
- The Entry: Rather than chasing the breakout, the trader waited for a pullback to the 50% Fibonacci retracement level, which aligned perfectly with the 50 EMA acting as dynamic support.
- Confirmation: A bullish engulfing candle formed at the support zone, while the ADX rose above 25, confirming strong momentum.
Example 2: The USD/JPY H4 Downtrend (Swing Trade)
This example highlights how a trader can use top-down analysis to capture a medium-term move.
- The Setup: The Daily timeframe was bearish, creating Lower Lows and Lower Highs.
- The Entry: On the H4 chart, price rallied back to a previous “broken support” level that now acted as resistance.
- Confirmation: A Pin Bar rejection appeared at the resistance level. The RSI showed a bearish divergence, suggesting the relief rally was exhausted.
| Element | Example 1 (Long EUR/USD) | Example 2 (Short USD/JPY) |
|---|---|---|
| Trend Identification | HH/HL Structure + Golden Cross | LL/LH Structure + Death Cross |
| Entry Trigger | Bullish Engulfing at 50 EMA | Pin Bar at Structural Resistance |
| Stop Loss Placement | Below the recent Higher Low | Above the recent Lower High |
| Targeting Strategy | 1:2 Risk-to-Reward Ratio | Trailing Stop to capture extended move |
| Risk Management | 1% of account balance | 1% of account balance |
Trend Trading vs Other Forex Strategies
| Strategy | Difficulty | Time Commitment | Best Market Condition |
|---|---|---|---|
| Trend Trading | ⭐⭐ | Medium | Trending markets |
| Range Trading | ⭐⭐ | Medium | Sideways markets |
| Scalping | ⭐⭐⭐⭐ | High | Any market |
| News Trading | ⭐⭐⭐ | Low | High volatility events |
Trend trading typically requires less screen time than scalping but more patience.
Common Trend Trading Mistakes
Even experienced traders can make mistakes.
Common issues include:
- Entering a trend too late
- Ignoring higher timeframe direction
- Moving stops to breakeven too early
- Closing winning trades too quickly
- Trading during low-liquidity sessions
Major forex trends often develop during the London and New York trading sessions.
Tools and Platforms for Trend Trading
Successful trading requires reliable infrastructure.
Professional traders rely on:
- high-quality charting software
- fast order execution
- price alerts and risk tools
- advanced technical indicators
Platforms such as MT4 and MT5 offer extensive analytical tools and automation capabilities.
If you want to practise trend trading without risking capital, you can open a free demo account with Hantec Markets and test your strategy using professional trading platforms.
When Trend Trading Does NOT Work (Avoid These Market Conditions)
Trend trading performs poorly in sideways or ranging markets, where price moves between support and resistance without clear direction. In these conditions, momentum is weak, and traders are more likely to experience false breakouts and repeated stop losses.
It is also less effective during low-volatility periods or choppy market conditions, often caused by conflicting economic signals or major news uncertainty. Without strong momentum, trends fail to develop or sustain. Professional traders avoid forcing trades in these environments and instead wait patiently for clear structure and momentum to return.
Is Trend Trading Profitable in 2026?
Trend trading remains profitable in 2026, but only for traders who apply it with discipline and a structured approach. Modern markets are still driven by macroeconomic forces such as interest rates and institutional positioning, which create sustained directional moves. Trend trading allows beginners to align with this momentum rather than fight it, making it one of the more reliable strategies when market conditions are favourable.
However, profitability does not come from perfect entries – it comes from risk management and consistency. Traders who maintain a risk-to-reward ratio of at least 1:2 and limit risk to 1–2% per trade can achieve profitability even with modest win rates. At the same time, trend trading performs poorly in sideways or low-volatility markets, so knowing when not to trade is just as important as knowing when to enter.
In practical terms, trend trading is profitable for those who treat it as a long-term process rather than a quick outcome. Beginners should focus on executing a clear plan, managing risk, and building consistency over time, as these are the factors that ultimately determine success.
Final Thoughts
Trend trading is not about constant activity. It is about disciplined participation in clear market moves.
The minority of traders who succeed do not predict markets better. They manage risk better. They follow structured rules and protect capital above all else.
In modern markets, the edge belongs to traders who combine patience, discipline, and a well-defined framework.
Build your strategy carefully, manage risk with precision, and always remember:
The trend is your ally.
FAQ
How long should a trend trade be held?
Until the trend structure breaks or a trailing stop is triggered.
Can beginners use trend trading?
Yes. Trend trading is often easier for beginners because it follows the market rather than attempting to predict reversals.
What currency pairs trend the most?
Major pairs such as EUR/USD, USD/JPY, and GBP/USD often produce sustained trends due to high liquidity and macroeconomic drivers.
How do you identify a trend quickly?
A trend can be identified by observing market structure. An uptrend forms when price creates higher highs and higher lows, while a downtrend forms with lower lows and lower highs. Traders often confirm this with moving averages, such as the 50 EMA and 200 EMA, to quickly assess direction.
What indicators work best for trend trading?
The most effective indicators are those that confirm direction and momentum. Common choices include moving averages for trend direction, the ADX for trend strength, and RSI or MACD for momentum confirmation. These tools work best when combined with price action.
How do traders know when a trend is ending?
Possible signals include:
- momentum divergence
- break of market structure
- decreasing volatility
- failure to create new highs or lows
Disclaimer: The content of this article is intended for informational purposes only and should not be considered professional advice.