

Table of Contents
- The Risk-Beta Heavyweight
- The Core Engine: Understanding the China Link
- The Conflict of the Commodity Cycle: Energy vs. Industrial Metals
- Economic Variables driving the AUD Macro Regime
- Institutional Liquidity Cascades in AUD/USD
- The Copper-to-Oil Ratio and the China Transmission Channel
- Final Thoughts: Managing the High-Beta Volatility
- FAQ: AUD Dynamics & Global Growth Strains
The Risk-Beta Heavyweight
In the institutional forex landscape, the Australian Dollar (AUD) holds a unique designation because it is the primary liquid vehicle used by global macro funds to express a direct directional view on global economic growth, industrial demand, and systemic risk appetite. Frequently dubbed a high-beta commodity currency, the Aussie’s intrinsic value is derived not from domestic retail activity or isolated regional data, but from its deep-seated integration into the global supply chain.
When global markets enter a high-volatility regime, such as the supply shock where Brent crude has pushed past $105 per barrel, the AUD often becomes a volatile battleground. Under standard economic theory, a broad-based commodity rally should provide a structural tailwind for a nation that sits on some of the largest natural resource reserves on earth.
However, the current energy crisis has exposed a critical vulnerability: when rising commodity prices are driven by geopolitical supply constraints rather than robust consumer demand, the Australian Dollar reacts far more violently to the resulting global growth fears than to the localized benefits of its export revenues.
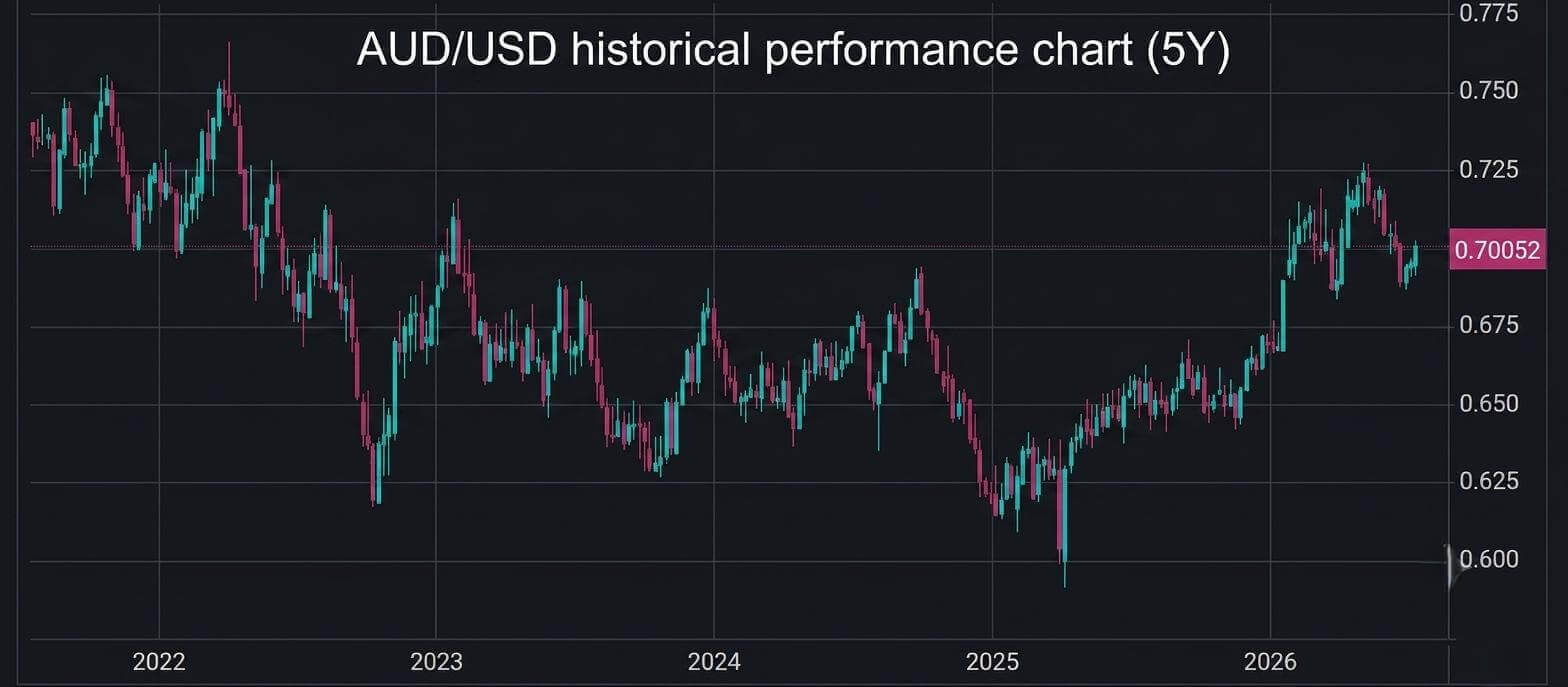
The Core Engine: Understanding the China Link
To understand why the AUD is so highly sensitive to global growth fears, one must analyze the structural architecture of the China Connection. Australia operates essentially as China’s primary mineral warehouse, meaning that the nation’s terms of trade are profoundly dependent on Chinese heavy industry, infrastructure spending, and steel manufacturing. When Chinese steel mills operate at high profit margins, demand for Australian iron ore expands dramatically, as seen recently when iron ore hit a significant peak of $111.90 per ton in May.
However, in the current macro environment, this industrial link is facing unprecedented stress. China’s economy is navigating inconsistent growth momentum, further weighed down by long-term property-sector weakness and fluctuating domestic manufacturing activity. When an external energy shock is introduced, it acts as a massive input cost inflation hurdle for Chinese factories.
Chinese manufacturing is highly energy-intensive, so as oil and global energy infrastructure costs escalate, the margins for these factories are heavily squeezed. If Chinese industrial engines begin to slow down under the weight of an energy tax, their demand for raw Australian industrial metals (such as copper and iron ore) contracts rapidly.
Consequently, AUD/USD traders quickly look past the temporary peak in iron ore prices and aggressively price in a structural slowdown in future transaction volumes. The market stops tracking current trade volumes and shifts entirely toward discounting the forward-looking demand destruction caused by the energy crisis. To monitor how these industrial pressures reflect on global asset classes, professional desks analyze the official reporting on global economic growth deceleration and industrial strains.
The Conflict of the Commodity Cycle: Energy vs. Industrial Metals
One of the most frequent mistakes made by retail trading communities is treating all commodities as a singular, uniform asset class. During a true energy crisis, a stark divergence opens up between energy commodities (crude oil, natural gas, coal) and industrial base metals (iron ore, copper, nickel, aluminum). Australia is an exporter of both sectors, but the economic weights and macroeconomic consequences of the two are vastly different.
Energy commodities act as a global tax because rising oil prices increase transportation, shipping, and supply chain costs everywhere. This dampens global consumer demand, reduces discretionary spending, and increases international inflation expectations. On the other hand, industrial metals operate as a growth barometer because base metals like copper are leading indicators of actual physical construction, technology manufacturing, and infrastructure expansion.
When oil surges due to geopolitical blockades rather than organic economic expansion, it forces central banks to maintain restrictive interest rates. These high rates hurt long-term capital expenditure projects, which directly causes industrial metals to sell off.
This creates a brutal cross-current for the Australian Dollar. While Australia’s LNG and coal exports capture higher nominal pricing, its vastly critical industrial metals sector faces severe headwinds due to the global economic slowdown. Whenever global growth fears override temporary resource price spikes, the AUD experiences sharp capital flight as global macro funds dump high-beta assets in favor of pure cash.
Economic Variables driving the AUD Macro Regime
| Economic Variable | Industrial Metals (Growth Barometer) | Energy Commodities (Supply Shock Tax) |
|---|---|---|
| Market Driver | Physical infrastructure and Chinese demand | Geopolitical bottlenecks and supply curbs |
| Price Trend | Heavy pressure due to manufacturing slowdown | Surging futures pricing (Crude above $105) |
| Impact on AUD | Direct capital outflows and risk-off liquidations | Nominal trade buffer that fails to trigger rallies |
Because the industrial slowdown carries a heavier weight on long-term capital allocations, the contraction in base metals dictates the real directional trend of the currency. Institutional capital flows naturally out of the high-beta asset when global manufacturing indices begin to deteriorate. Therefore, even if regional export data shows short-term resilience, the broader macro liquidation flows dominate the daily price action.
Institutional Liquidity Cascades in AUD/USD
Because the AUD/USD pair serves as the primary liquid proxy for global growth and Chinese economic risk, its market micro-structure is heavily dominated by algorithmic execution and institutional order books. During periods of geopolitical stress, AUD/USD frequently tests key institutional liquidity zones. These psychological and structural chart areas represent price points where large-scale asset managers, global sovereign wealth funds, and automated trend-following models cluster their primary positioning.
When global risk sentiment deteriorates, liquidity in the interbank market for high-beta currencies thins out rapidly. If AUD/USD fails to maintain key overhead structural support levels, it often triggers an algorithmic cascade. Sell-stop orders are executed automatically, forcing prime brokerages to liquidate long exposures into a dropping market.
This momentum is frequently accelerated by the unwinding of cross-currency carry trades. Fund managers who borrowed capital in low-yielding currencies to fund long positions in high-beta assets like the AUD rapidly cover their positions to mitigate risk, resulting in violent, sharp downward corrections that completely disregard short-term domestic economic resilience. To understand how these global capital reallocations impact risk assets, traders trace the benchmark assessments on sovereign capital flows and financial stability indicators.
The Copper-to-Oil Ratio and the China Transmission Channel
Understanding the real-world flow of the Australian Dollar requires looking beyond localized price points and focusing on the underlying transmission channels. The primary indicator used by international institutions to assess this risk is the copper to oil ratio, which functions as an elegant shorthand for global economic health. When copper prices stagnate or break down while crude oil futures surge, it signals to the broader market that industrial manufacturing margins are being hollowed out by an energy burden, creating an immediate structural filter that limits appetite for the Australian currency.
This pressure is further amplified by the behavior of the offshore Chinese Yuan, which acts as a massive psychological anchor for regional trade blocks. Because of the deep structural integration between mainland industrial demand and Australian mining corporations, any technical or fundamental breakdown in the Chinese currency tends to precede downward pressure on the AUD/USD pair. This correlation highlights why global asset managers treat the Aussie as a macro proxy, since its daily fluctuations are frequently determined by capital reallocations triggered thousands of miles away from Sydney.
Final Thoughts: Managing the High-Beta Volatility
The intense sensitivity of the Australian Dollar to global growth fears highlights a critical reality of the 2026 market regime: nominal resource prices mean nothing if the underlying industrial consumption engine is under stress. While Australia’s massive natural reserves provide a theoretical cushion, institutional fund flows will consistently treat the AUD as a liquidation asset whenever global manufacturing margins face an energy tax.
For professional analysts, success requires tracking the cross-asset landscape with extreme discipline. By monitoring the real yield environment and Chinese currency developments rather than relying on standard isolated charts, traders may be better positioned to identify potential institutional entry points. To stay updated on how these commodity fluctuations impact global liquidity and pricing, professional desks follow the real-time adjustments on the Trading Economics Commodity Price Index.
FAQ: AUD Dynamics & Global Growth Strains
1. Why is the AUD falling if iron ore and other Australian resource exports are trading at high prices?
The market is discounting future demand rather than tracking current export volumes. While iron ore reached a high peak of $111.90 in May, a geopolitical energy shock acts as a severe tax on China’s manufacturing sector. Because Chinese heavy industry is highly energy-intensive, surging oil prices squeeze factory margins and slow down production. Institutional traders look ahead and realize that this industrial slowdown will eventually destroy demand for Australian base metals, leading them to liquidate AUD long positions prematurely.
2. What role does the USD/CNH currency pair play in predicting AUD/USD price movements?
The offshore Chinese Yuan (USD/CNH) serves as a critical leading indicator for the Australian Dollar. Because Australia operates as China’s primary mineral provider, the financial health of the two economies is deeply intertwined. When the Yuan weakens against the Dollar, it indicates growing economic stress or capital flight within China. This weakness almost always cascades into the AUD, making it essential for professional traders to monitor USD/CNH resistance levels before entering long AUD setups.
3. How does a global “risk-off” environment trigger algorithmic cascades in the AUD/USD order book?
In times of high geopolitical stress, global asset managers rush to convert risk-sensitive assets into cash, particularly the U.S. Dollar. Because the AUD is classified as a high-beta proxy for global growth, it faces immediate institutional selling pressure. As liquidity in the interbank market for high-beta currencies thins out, the currency falls toward major technical support zones where massive clusters of retail stop-losses reside. Institutional algorithms may seek to take advantage of these lopsided order books by sweeping liquidity, triggering automated sell-stop chains that accelerate the downward momentum.
4. Why do industrial metals and energy commodities diverge during a geopolitical supply crisis?
They respond to completely different economic forces. Energy commodities like crude oil move higher due to supply disruptions and transport blockades, acting as an artificial cost increase for the entire global economy. Industrial metals like copper and aluminum rely entirely on active construction, capital expenditure, and factory production. When high energy costs spark inflation, central banks keep interest rates restrictive, which kills long-term construction projects and causes industrial metals to break down despite rising oil.
5. Is the AUD/JPY cross a better vehicle to trade during an energy crisis than the AUD/USD pair?
The AUD/JPY cross is often preferred by institutional macro desks because it strips out the broad-based U.S. Dollar safe-haven flows and isolates pure risk sentiment. Japan is a heavy net importer of energy, meaning a crude oil spike severely hurts its terms of trade. Australia is an energy exporter, creating a clear fundamental divergence. However, because both currencies are highly sensitive to safe-haven liquidations (with JPY catching intense safety flows during market panics), the cross pair provides massive intraday volatility that requires institutional-grade risk parameters and strict limit execution.
Disclaimer: The content of this article is intended for informational purposes only and should not be considered professional advice.