CFDs are complex instruments and come with a high risk of losing money rapidly due to leverage. 61% of retail investor accounts lose money when trading CFDs with this provider.

You should consider whether you understand how CFDs work and whether you can afford to take the high risk of losing your money.

Please be advised that our Client Portal is scheduled for essential maintenance this weekend from market close on Friday 5th April, 2024, and should be back up and running before markets open on Sunday 7th April, 2024.

We’re excited to share that we’re gearing up for an update to our Client Portal, aimed at improving your experience with us. Client Portal will be unavailable to you from market close on Friday 16th February, 2024, and should be back up and running before markets open on Sunday 18th February, 2024.

CFDs are complex instruments and come with a high risk of losing money rapidly due to leverage. 61% of retail investor accounts lose money when trading CFDs with this provider.

You should consider whether you understand how CFDs work and whether you can afford to take the high risk of losing your money.

Search
Close this search box.

MetaTrader 5 MT5 Trading Platform

MT5 trading platform provides you with everything you need to trade the financial markets. MT5 is easy to use and fully customisable to suit beginners or experienced traders, with an advanced environment of additional features.

What is MetaTrader 5?

MetaTrader 5, commonly known as MT5, is the latest and most powerful online trading platform developed for retail financial traders. 

This platform retains the interface you may already be familiar with, in MT4, but boasts superior market depth, technical tools, customisations and much more. 

Making MT5 not only an easy to use platform for beginners, but the perfect platform for traders looking to better their trading skills. It is also a great platform for multi-asset and experienced traders looking to widen their portfolios and achieve more accurate technical analysis.

Features

  • 2,650+ available symbols
  • Desktop, mobile and web browser applications
  • Copy trading compatible
  • 38 Technical indicators
  • 21 Time frames
  • 44 Graphical objects
  • Strategy tester
  • Hedging
  • In-built Economic Calendar
  • 6 Pending order types
  • Netting account available on request

Download MetaTrader 5 for PC

Download MT5 for Windows and take advantage of everything MT5 and Hantec Markets have to offer. 

Alternatively, if you run Mac or Linux operating systems, we have a solution for you. Start trading now on MT5 WebTrader available for all web browsers.

System requirements: Compatible with Microsoft Windows 2008/7/8/10 operating systems.

Download MetaTrader 5 Mobile

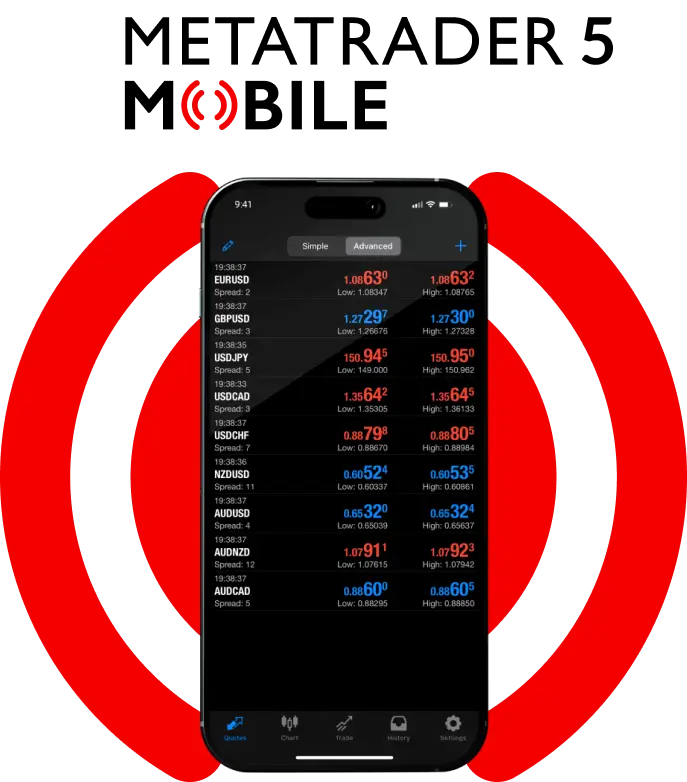
With Hantec Markets MT5 Mobile you can have complete control over your trading from anywhere at anytime. 

MT5 Mobile empowers beginner and expert traders with technical analysis through the built-in set of indicators and analytics tools.

Control, monitor and trade currencies, bullion, stocks, indices, and more, with just one touch!

MetaTrader 5 Web

Start trading from any browser and any operating system without the need to install any software. 

If installation is not supported on your desktop operating system or mobile, MT5 Web Trader is the perfect solution for you. Maintaining reliable data protection and real-times quotes equal to the application forms of MT5. 

MT5 Web Trader still allows you to performance comprehensive market analysis using a broad range of technical indicators, graphical objects, market depth as well as 3 chart types and 9 time frames. 

Compatibility with Windows, Mac and Linus operating systems.

2,650+ Symbols

Metatrader 5 was designed as a true multi-asset platform, making trading both Forex and non-Forex CFDs easier.

Therefore we have massively increased our range of tradable symbols available on MT5. In addition to all symbols available on Hantec Markets MT4, we have included 1,785 US Stocks, 302 European Stocks, and 88 ETFs.

Trading Central Tools

Using a unique approach backed by extensive research and time-tested indicators, you can access deeper market insights and trends at ease with Trading Central’s Alpha Generation Indicators.

Advanced charting package and technical indicators that help clear the noise on your charts; the pattern recognition models make it simple for you to make trade decisions in the market. The three innovative indicators consider technical set ups, represent market psychology and highlights entry/exit points.

Download Trading Central Plug-in

Frequently Asked Questions

Already have a Live Trading account with Hantec Markets?

You can create a new MetaTrader 5 account within the client portal by selecting the account type, base currency, and leverage and agreeing to the terms and conditions.

You don’t have a Live Trading account with Hantec Markets?

To open a real, active MetaTrader 5 trading account, simply follow the link to open a LIVE account. Once the account opening process has finished, you’ll be able to sign in to MT5 or MT4 and begin trading.

For the best MetaTrader 5 Mac trading experience, we recommend you run the Hantec Markets MT5 WebTrader.

Launch MT5 WebTrader now but click here

  1. Open MT5
  2. File>Open data folder
  3. Select MQL5>’Experts’ or ‘indicators’ and paste your MQLR/EX5 file into this folder.
  4. Close and re-open MetaTrader 5
  5. You will now see your EA in the Navigator window.

ETFs or Exchange-Traded-Funds offer you a way to invest in a wide range of shares in one package. Where stocks or equities represent shares within individual companies, ETFs offer shares of multiple companies within a single product.

You may regularly see references to MQL5, MQL stands for MetaQuotes Language. The number corresponds to the platform, i.e. MQL4 is for MetaTrader 4 and MQL5 is for MetaTrader 5.

The major difference of MQL5 from other programming languages ​​is its trading specialization. An impressive set of built-in MQL5 functions for technical analysis and trade management, allows creating applications for automated market analysis and financial trading.

Additional Information

Introduction to Hantec Markets MetaTrader 5

The purpose of this guide is to give you an understanding of how to use the main features of MT5. To get the best out of this guide we recommend following along with our MT5 trading guide video found on this page.

Step 1: Download the platform

Download for Windows
Launch WebTrader

Step 2: Open a live or demo account

  • If you already have a Hantec Markets MT4 Live account, you can simply create a new MT5 account within the client portal.
  • If you do not yet have a Hantec Markets Live account, you can register here in 4 easy steps.
  • If you prefer to first go through some easy-to-understand simulation on a demo account, you can register here in minutes.

Step 3: Launching the terminal

  • To launch MT5 for Windows, click the Hantec Markets MT5 application
  • To launch MT5 web trader straight away, click here.

Step 4: Navigator and Market Watch window

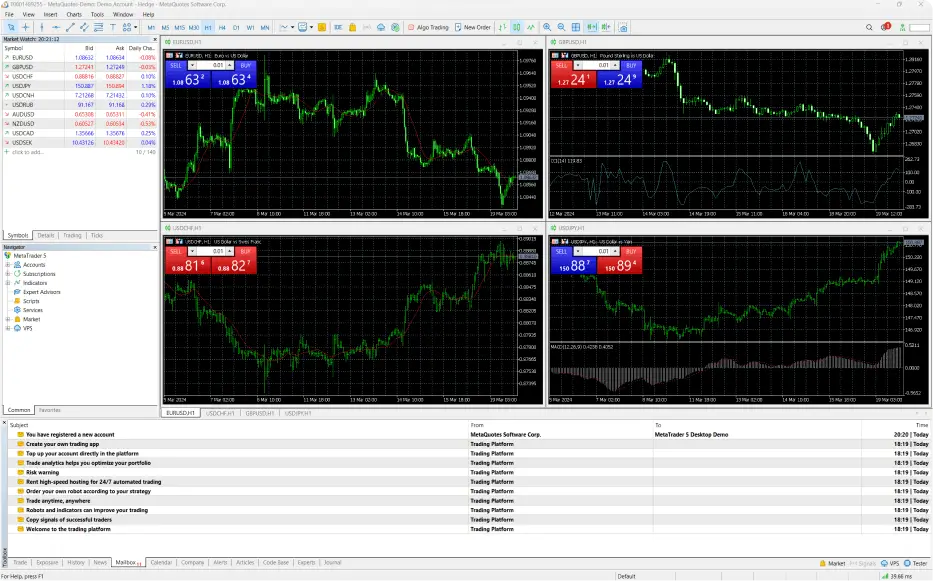
  • After opening the terminal, on the left-hand side you can see the Navigator and Market Watch window. If either of these windows do not appear, click ‘View’ and select what you want to view on your platform.
  • The Market Watch window is where all the Market assets that Hantec Markets makes available to you are listed.
  • To show all, right-click on any asset and select Show All. If you don’t want to view all the symbols, just select specific assets, click + Click Add > type the name of the asset you want to add and hit Enter. That way you can add only the assets you operate to customize your platform.
  • In the Navigator window will see all your accounts that you add to your platform. By placing the cursor over the account number, you will be able to view the leverage you selected and the balance you have for that specific account. In this window you will also be able to see the indicators, there are already some indicators of the platform, such as trend indicators, oscillators, volumes and some custom indicators that you can also add to the platform. There are already some examples of robots available.
  • We also have Trading Central indicators backed by extensive research to gain deeper market insights and trends with ease. You can download Trading Central’s Alpha Generation Indicators here.

Step 5: Trading and History tabs

  • At the bottom we have the Toolbox, inside this box there are several tabs – and the most used tabs are trading and history.
  • Inside the Trading tab, you will see all open orders, both market and pending orders. In addition, it will display the balance, net capital and free margin.
  • Inside the History tab, you will find all closed orders and information about these orders, such as profit and loss, stop loss and take profit, volume, asset, the value you opened the order, the value you closed, etc. If you want to see more information, right-click on the order > columns, and select what you want to see.

Step 5: Toolbar

  • Next let’s look at the Toolbar, this is found in the ‘File’ tab where you will find Profiles option where we will teach you how to save your profile later in this guide.
  • You will also fine the ‘Open Data Folder’, where you will place custom indicators or expert advisors.

Step 6: View tab, setting language and Insert tab

  • Inside the ‘View’ tab, we have a list of languages that are available to the platform. Under View we also have Toolbar where you can customize yours if you wish.
  • In the ‘Insert’ tab we have the indicators, or you can also select the indicator in the Navigator window and drag it to your chart. In objects are the figures that are already on our Toolbar. In Windows you can select how you want to view your graphics windows, such as waterfall, side by side and so on.

Step 7: Reviewing the Toolbar

Regarding the tabs within the Toolbar, what we have mentioned so far are the most used options, the rest you will discover as you explore the platform further. We won’t explain every option in this guide to ensure the guide is not too overwhelming as it’s designed for beginners. But please feel free to reach out to our Customer Services team for further information.

Step 8: Time frames and graphic objects

  • Remembering that it is possible to customize the Toolbar by clicking and dragging the icons to organize them the way you prefer. For example, graphic time options, we have 1 minute, 2 minutes and so on. As you change the time frames, the bars on your chart will change, each bar is equivalent to the selected timeframe.
  • With the cross cursor you can see the exact time, at the bottom of the chart and in the right corner you will see the value that is currently active on the chart.
  • Then we have some lines of studies, a vertical line, a horizontal line – to trace the support and resistance studies and a diagonal line. If you want to delete all lines, click Graphics > Objects > Delete All, or to delete individually, double-click on the line and press “delete”.

Step 9: Fibonacci Retracement

  • Again, on the Toolbar we have Launch Fibonacci Retracement that you can configure by selecting and right clicking > Fibo Properties.
  • By clicking on Launch Text, you can write on the graph, so selecting this option will open the screen to change the settings. In Launch Arrow, there are symbols that you can add to your chart and customize.

Step 10: Asset search and chart type

  • Clicking on $ Show Asset List allows you to search for an asset, when you click on the asset it will open the specifications below. New Order will open the ticket.
  • You can also select the type of chart you want to use, here we have the bar chart, candlesticks, and the line chart.
  • There is also an option to zoom in, zoom out. Clicking this icon moves the graphic away from the edge, and the icon on the side is the auto-scroll icon.

Step 11: Graph structure

  • Now to explain how the graphs are structured. On the bar chart, the horizontal trace on the left side shows the opening price and the trace on the right side shows the closing price of the bar.
  • Each bar corresponds to the selected time frame, for example, if it is in M15 each bar is equivalent to 15 minutes.
  • The vertical line of the bar equals the price movement, we know that the bar is positive if the opening price is below the closing price, and we know that it is negative if the opening price is above the closing price. If the opening price was the same as the closing price, this bar is called a doji. The bar structure gives us 4 pieces of information, the opening price, closing price, the high and the low.

Step 12: Candlestick chart

  • Candlestick chart, what makes the difference? When the body is hollow, the candle is positive, when the body is filled the candle is negative. The candlestick structure gives us the same 4 pieces of information as the bar chart, the opening price, closing price, the high and the low.
  • The line chart only shows one piece of information, the closing price. It joins the closing price of each bar, each candle and draws the line forming the chart. Typically, this chart is mostly used to chart support and resistance.

Step 13: Configuring your chart

  • Right click on the chart > then select properties.
  • This window will open with three tabs, this window is where we configure our chart in the way we think is best. You can change the chart type, and what you want to appear on the chart – such as ASK price, grid and etc., and adjust the colours.

Step 14: Placing and saving an Indicator

  • We will now learn how to place an indicator, in the Navigator window we will select an indicator – for this example we will select the Moving Average indicator, then click and drag the indicator onto your chart.
  • This will open the configuration window, you can select the periods, the averaging type, the colour, and the thickness. When you click ‘OK’ the line will appear on your chart. This is the way to add indicators on the platform.
  • You can save this template for the other assets. To do so, right-click on the chart > templates > then save template. Once saved, open the graphic of the other asset that you want to apply this template > right-click > templates and select the template you want to use. You can create as many templates as you like.

Step 15: Order types

What types of orders can we open? The answer: Market execution and Pending Order.

  • Click on New Order, in the ticket you can choose the asset you want to trade, the type of order, volume, stop loss and take profit. You can add stop loss and take profit both at the time you open the order and when the order is already open, in the Toolbox > trading you can right click on the order > modify or delete.
  • In addition to these forms, once you open the order you can also click and drag to place your SL and TP. If you, do it this way, the first time you will see the One Click Trade screen, select cancel and then modify.
  • To place a Pending Order you will need to place your cursor on the price line you want the order to open when it hits. Right click > trade and select Sell if you want to sell and Buy if you want to buy. A dashed line will appear on the chart at the selected price and your order will open when it reaches that price. You can also open it via the New Order button > order type – Pending Order > select buy or sell and enter the price you want.
  • Note that when we open an order, it usually opens negative because of the spread. In the trading tab you will see the information of your open order in real time. In a Market Execution order, the order will be above the balance and free margin information. A Pending Order will be below this information, it will move up when it reaches the stipulated price and opens the order.
  • You can close your order at any time by clicking on the little “X”. After closing the operation, you will be able to view your order in the History tab, there you will have all the information of your executed orders that were closed.

Please be advised that we remind you the purpose of this guide is for educational purposes, and we recommend you first try on a demo account if you are not familiar with trading basics.

We remind you that the purpose of a guide is for the client to become familiar with the platform, test strategies and build trust.

We hope this Introduction to Hantec Markets Metatrader 5 guide has helped you to get to know the platform better.

Installation
To start trading from your mobile device, download MetaTrader 5 here or from the Google Play application on your Android device. After installation, run the application by tapping the Hantec Markets icon on your device. 

Connecting to your Hantec Markets Account or opening a demo account

  • Login to an existing account allows connection to your Hantec Markets Live account. Input the details found in your account confirmation email.
  • Open a demo account should be used if you want to open a new demo account or visit our demo account sign up back here.

Understanding the application GUI
The interface of the MetaTrader 5 mobile platform is designed to switch between the maun fuctions of the program:

    • Quotes is a window with prices of financial instruments.
    • Chart view price charts.
    • Trade displays account state and features options for managing trade positions and pending orders
    • History view the history of trade operations.

Installation
To start trading from your mobile device, download MetaTrader 5 here or from the AppStore application on your iPhone or iPad. After installation, run the application by tapping the Hantec Markets icon on your device.

Connecting to your Hantec Markets Account or opening a demo account

  • Login to an existing account allows connection to your Hantec Markets Live account. Input the details found in your account confirmation email.
  • Open a demo account should be used if you want to open a new demo account or visit our demo account sign up back here.

Understanding the application GUI
The interface of the MetaTrader 5 mobile platform is designed to switch between the maun fuctions of the program:

  • Quotes displays information on real-time prices of financial instruments
  • Chart provides a price chart and technical analysis options. For example, indicators and graphical objects.
  • Trade displays account state and features options for managing trade positions and pending orders
  • Settings allows access to mailbox, new and options to open a new account or switch between available accounts.

You can download the MetaTrader 5 platform in four easy steps. If you need assistance, our expert advisors are available to offer advice and technical support.

MetaTrader 5 Downloads

Download the MT5 platform, and get access to your live or demo account from your desktop or mobile device.

Popup title

Lorem ipsum dolor sit amet, consectetur adipiscing elit. Ut elit tellus, luctus nec ullamcorper mattis, pulvinar dapibus leo.

Lorem ipsum dolor sit amet, consectetur adipiscing elit. Ut elit tellus, luctus nec ullamcorper mattis, pulvinar dapibus leo.

Lorem ipsum dolor sit amet, consectetur adipiscing elit. Ut elit tellus, luctus nec ullamcorper mattis, pulvinar dapibus leo.


rotator.png

We are transferring you to our affiliated company Hantec Trader.

Please note: Hantec Trader does not accept customers from the USA or other restricted countries.