 Balance Guard
Investing in Gold in 2023: Top Trends and Projections for the Near Future
Why Should a Trader or Investor Consider Gold?
There are many benefits that an investor can enjoy from investing in gold which is one reason why it often forms a cornerstone to any investment portfolio, be it under active or passive management.
One reason for this is that gold is a "precious" metal, i.e. it is rare, and the value of gold is not always closely correlated with other asset classes such as bonds, equities or real estate. Unlike "Fiat" currencies e.g. United States Dollar (USD), British Pound Sterling (GBP) or the Euro (EUR), gold is a finite commodity...maybe even a currency. That is why global central banks hold so much within their reserves, Figure 1 (A).
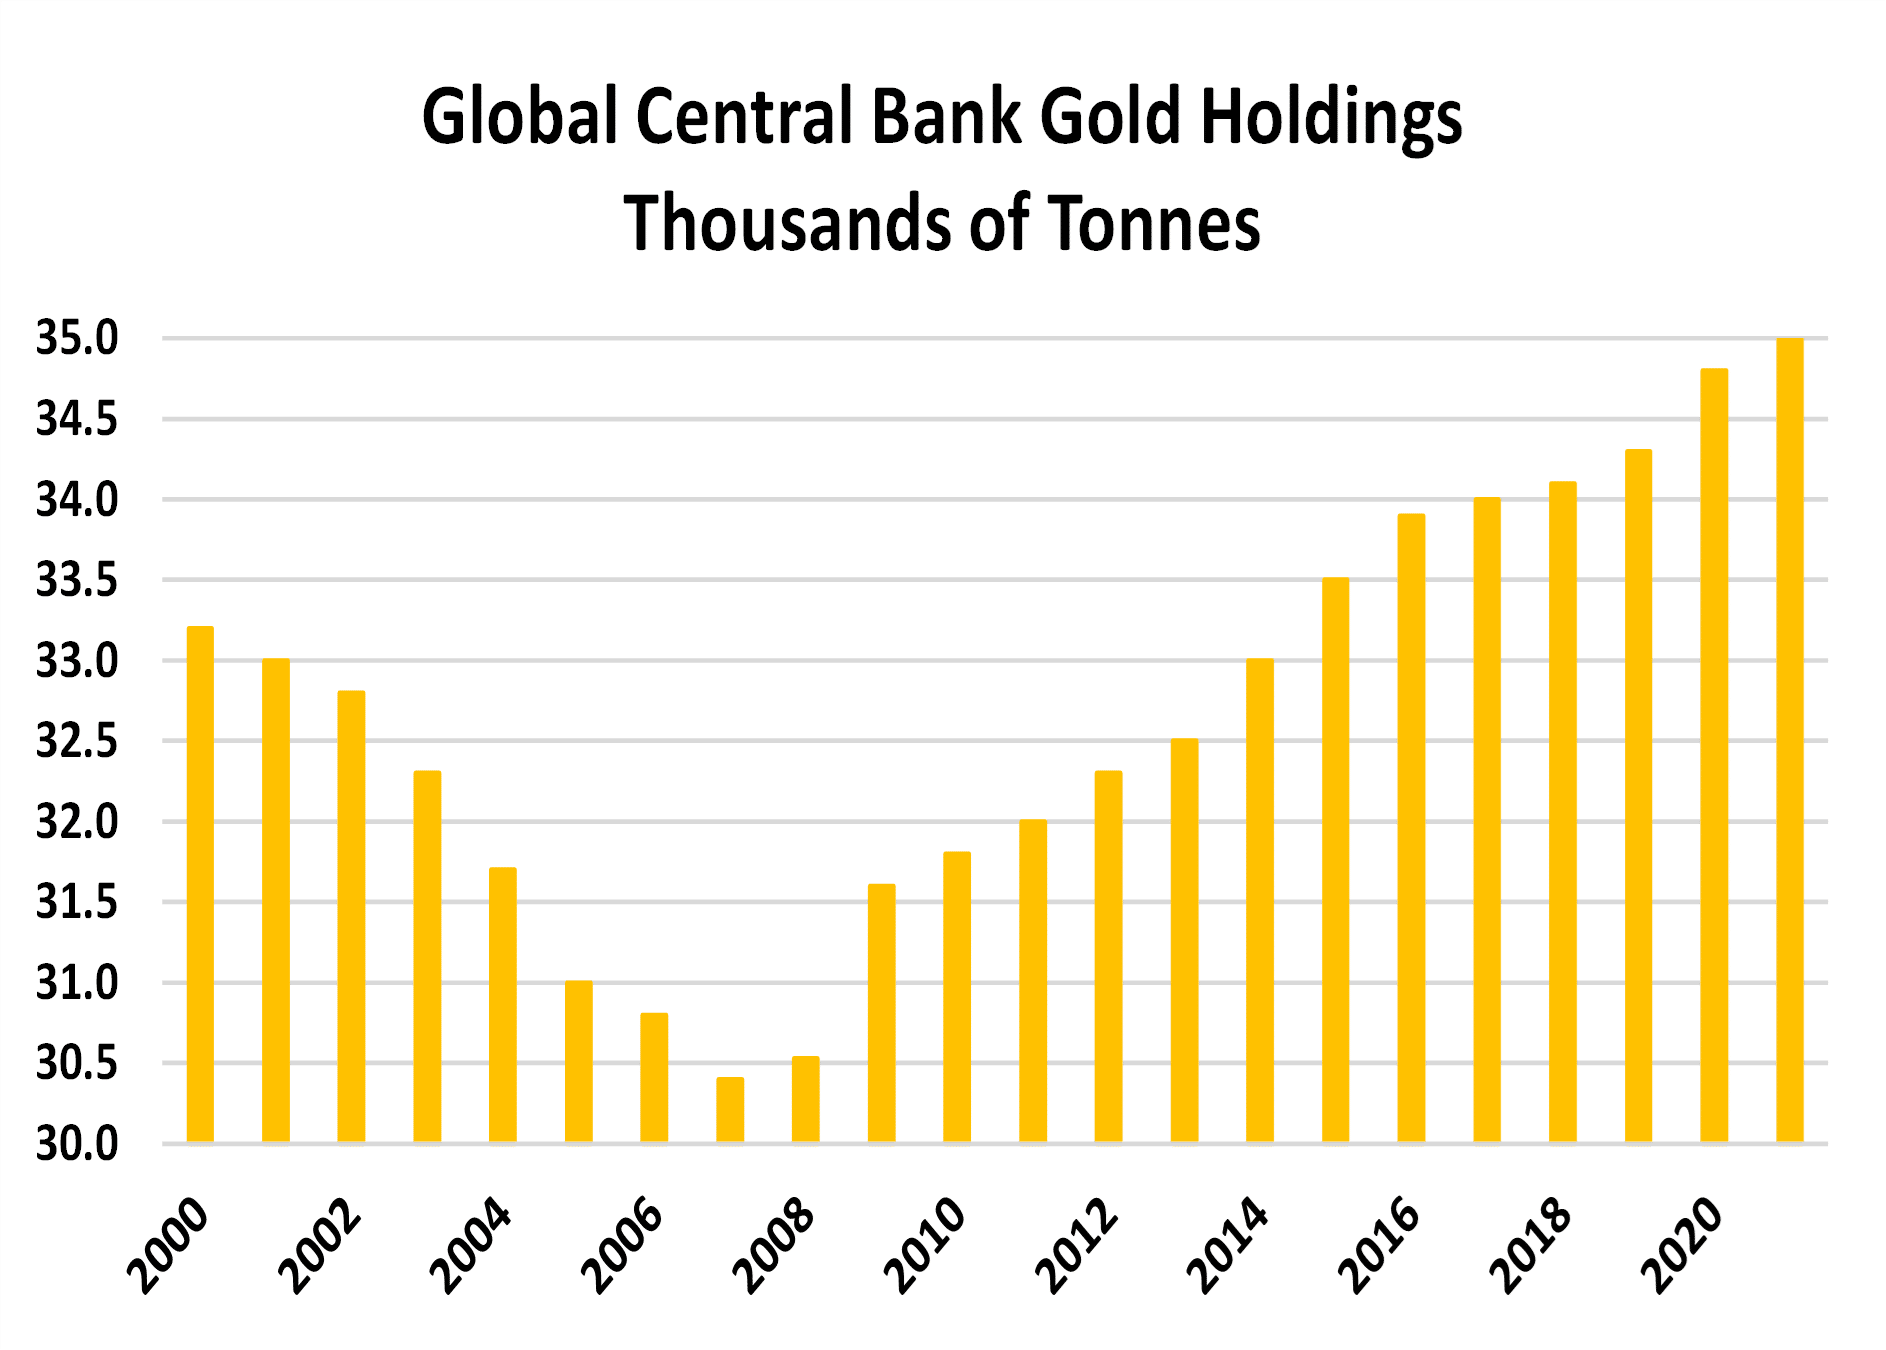
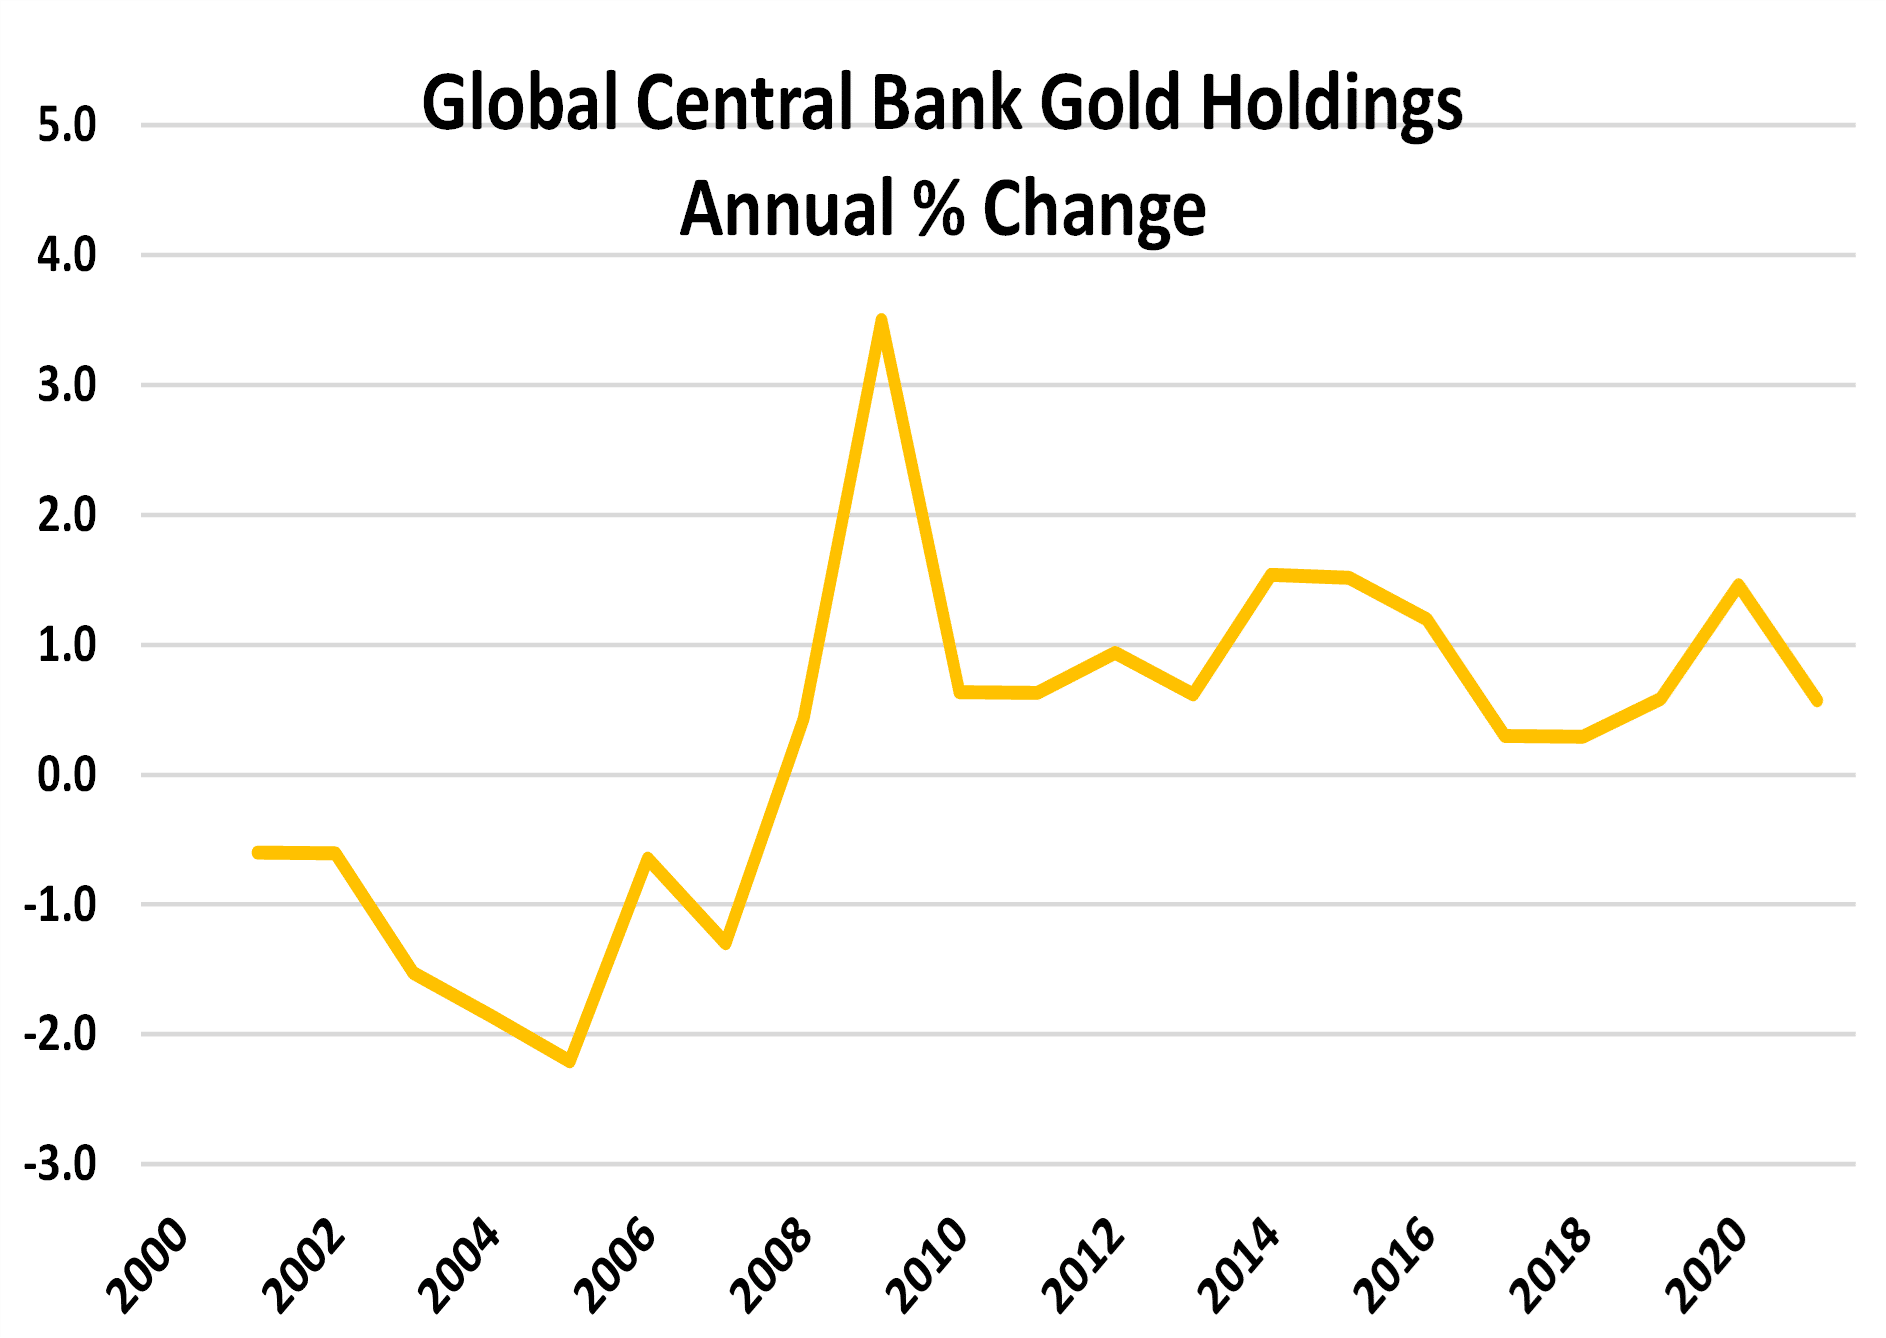
Although the Year-on Year percentage change has stabilised over the past decade, Figure 1 (B), one can still see that the world's central banks have steadily maintained their pace of accumulating gold, with many looking to repatriate their holdings to their own vaults to avoid any jurisdictional risk. This pattern appears to be far from over, as the safe-haven status of gold has accelerated since hard-hitting sanctions were imposed on Russia following the 2021 invasion of Ukraine. Action by Western allies froze Russia's access to approximately USD 300 Billion in reserves held in foreign currencies. However, gold bullion remained largely beyond their reach.
One should also note that since 2008, the People's Bank of China (PBoC)has been rotating its reserves away from US Treasury securities into gold. In November 2022, PBoC holdings of US Government debt declined by USD 7 Billion cf. October 2022. China has actively boosted its gold reserves as part of a "De-Dollarization" programme.
Data from the World Gold Council (WGC) indicates that in 2022 the global central banks acquired more gold than they have since 1967, although the annual pace is now steadying at just under +1% YoY.
What Are the Compelling Reasons for An Individual To Buy Gold?
If one acquires a share in a company's equity, ownership will have to be registered. That ensures dividends, if any, are paid to the appropriate account. Gold, in contrast, does have such a requirement and, as a private store of wealth, can prove to be a tax-efficient means of transferring wealth down to future generations.
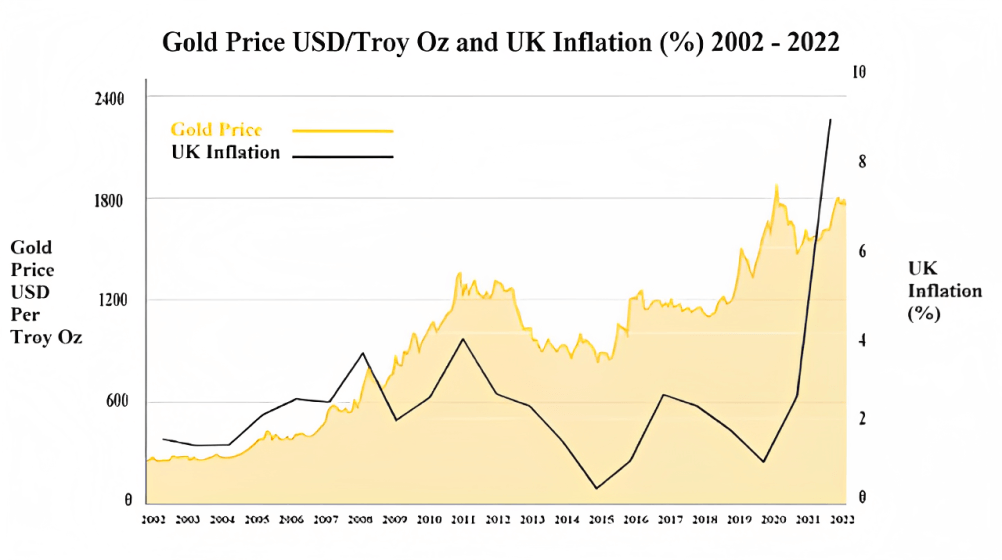
One of the main attractions is that gold has consistently proven itself to be a good hedge against inflation. Analysis by the WGC reveals that since 1972 gold has returned 15% per annum on average when inflation is higher than 3%, compared to just over 6% per annum when inflation is lower than 3%, Figure 2.
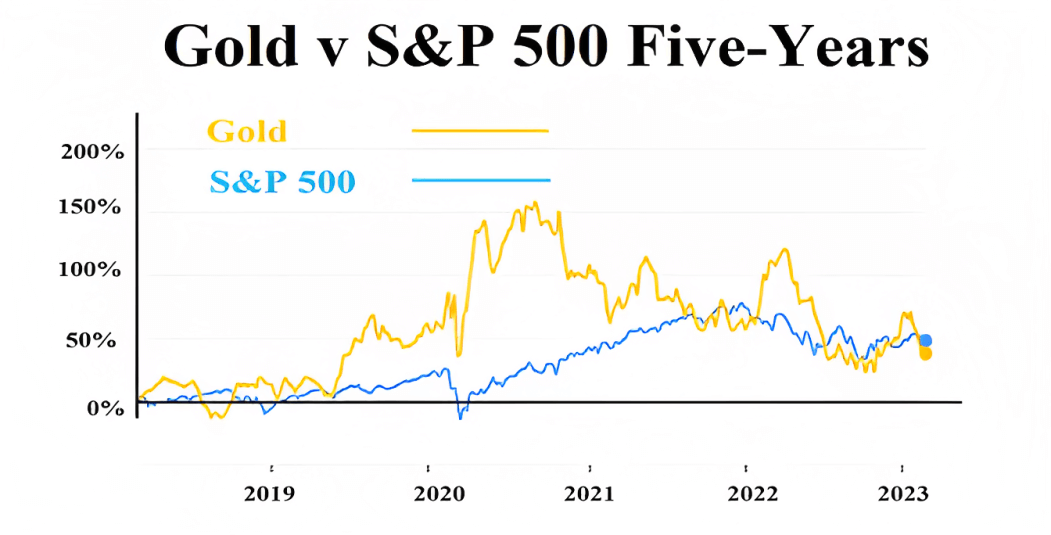
Gold has also, since 2018, generally stayed ahead of the broad equity market, e.g. the S&P 500, Figure 3.
Gold also started to enjoy a rise in investment from the general public in 2008 during the Global Financial Crisis as by converting savings or pension assets into physical gold, they were actively removing their personal wealth from the banking system. At a time when banks were not finding much trust among each other and, in some cases, needed government support investors could immunise themselves from the associated counterparty risks.
How Can One Invest in Physical Gold?
Many sites that address the question of what asset allocation should be adopted will, of course, talk about factors such as one's time horizon and risk profile. Those considerations determine what mix of debt and equity one may seek. Within that, one can become more granular by looking at credit ratings and equity sectors.
However, a fairly constant weight in a general portfolio is that gold should account for 5% to 15% of the total holding.
We have already seen that physical gold is held by central banks as a good store of wealth that can gain in value when inflation is running high. So what can one do as an individual investor?
Coins
Modern bullion coins offer an opportunity to own investment-grade gold coins that are "legal tender" and are available at a small premium over the quoted spot gold price.
Gold, as well as silver and platinum, are available in the form of bullion coins, with the most popular coming from the United Kingdom, the United States of America, Canada, South Africa and Australia. One can also buy small gold bars from many banks right down to just 1 gram in weight.
A more esoteric approach can be to buy numismatic or older and rare coins. These are bought for both the precious metal as well as their rarity and historical value. One may find many are positively leveraged to the spot gold price. In short, they will gain more than gold in a bull market yet decline faster when the bear market bites.
Gold Shares, Certificates and CFDs
Beyond a certain point, holding physical gold is expensive and can become complicated. An alternative can be found by acquiring gold shares or certificates to generate the required portfolio exposure or by trading Contracts for Difference (CFDs), as you can with Hantec Markets.
Gold shares are similar to holding equities. However, in buying targeted gold mining stocks, one is making a deliberate play on the potential movements in the gold market. The advantage is that investing in gold shares is more likely to deliver an immediate return when compared to gold bullion, as there is no need to close out legacy warehousing expenses.
With gold certificates, one may find documents that prove ownership of gold. They can look like a banknotes as the original gold certificates were issued by banks and financial institutions as proof of ownership for gold deposited with them.
An alternative meaning of a gold certificate is an assay card, i.e. a certificate of authenticity. This could form part of the packaging of a gold bar or a separate piece of paper and is considered additional proof of the legitimacy of gold.
Gold certificates form part of the "catch-all" term "paper gold". Other forms of this paper gold include Exchange Traded Funds (ETFs), gold CFDs and gold futures, as well as the shares in gold miners, as mentioned above.
Paper gold serves the same function as gold bullion, although there is one layer of separation from the physical metal... and that is counterparty risk. That means one has to constantly ask and check if the bank where one's gold is deposited honour its obligation. Will the gold miner stay solvent? These are the many dilemmas an investor must face.
What Is the Outlook for Gold Prices?
Three Months:
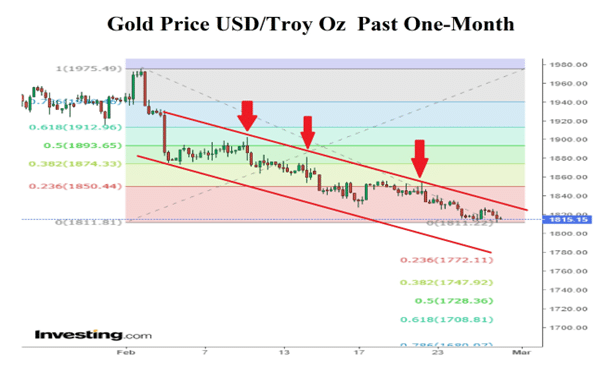
In Figure 4, one can see a price slip on February 2 that reversed the prior session gain. This was followed by a sharp decline of 2.79% on February 3, which marked the start of the almost one-month-long corrective channel.
Although the price has migrated to the upper level of the channel since February 17, the inability to challenge the channel top more than once speaks to a major sense of fatigue. Prices are struggling to move above USD 1815 or USD1816 /Troy Oz, and that implies the short-term outlook is for further declines toward the current 200-Day Moving Average, which is set at USD 1838/Troy Oz.
Much will depend on the next round of inflation readings, US CPI on March 14 and PPI on March 15 and the next interest rates steps taken by the main central banks, especially the Fed on March 22.
If CPI in the US can hold at 6.4% or print lower, that should allow the Fed to show restraint once again and edge toward another 25 bps move so setting a target of 4.75% to 5.00%. Of course, there are many hawks that were left smarting after they could not create a 50 bps hike last time and so they will be ramping up the rhetoric for a steeper hike this time round.
If the softer pattern endures, indeed, becomes ingrained, then over the next three months, gold will likely decline towards USD 1772 to 1782/Troy Oz.
Six-Months and Twelve-Months:
The further out one places a price forecast then the greater one has to stress that casting a shadow over the issue is the potential for geopolitical tensions to rise. The most obvious trouble spot is the Russian invasion of Ukraine. It looks set to be a protracted conflict as President Putin has doubled down on laying the blame at the door of NATO and the West in general.
Expect the conflict to rumble on and that it will disrupt supply chains and commodity prices, keeping inflation at an elevated level, although off the worst seen so far, i.e. 9.1% in the US, 11.1% in the UK and 10.6% in the Euro Zone.
It has to be stressed that this could, of course, change if Russia starts to see further losses so, driving President Putin to take punitive action by curtailing crude oil and/or oil products and, of course, gas supplies, resulting in a global supply shock.
We mentioned earlier that China has been diversifying away from USD-denominated assets, and whilst other wealthy nations, such as The Kingdom of Saudi Arabia, will not break with the US, we do not expect them to rush into filling any oil market supply gap as they undertake broad hedge activity against the US Dollar.
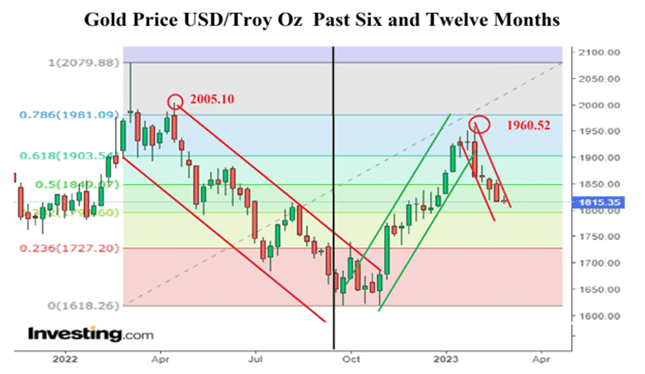
Figure 5 is divided at the six-month mark, and it appears that the gold price is repeating the pattern of March 2022 through the August 2022 period, albeit not quite making the same high.
The momentum looks to be heading lower; however, if the price finds support at USD 1815/Troy Oz, as was the case in December 2022 when the upside paused for several sessions, then the intensity of the recent decline could lead to gold being short-term oversold.
Does any rebound that stems from that imply a rebound that can last for the next three- or six months? That would simply delay further corrective declines that will gain traction so long as there is no pushback to USD 1850/Troy Oz. The bearish scenario, which we are more inclined to support for the next six months, is for a decline to USD 1760/Troy Oz that runs down to a twelve-month retreat to USD 1720/Troy Oz. Should President Putin up the ante either economically or in the military sense, a gain over USD 1850/Troy Oz will USD 1903 and USD 1980/Troy Oz.
Gold takeaways
Whether you are looking to trade Gold with Hantec via CFDs or invest in Gold, the outlook is certainly uncertain, but we hope that this article has given you better insight into the prospects for gold in 2023 and beyond.
Top 5 Blogs