The Euro vs. the Dollar: A Comprehensive Forecast for 2023
In this post, we are going to be analysing the EUR/USD forex pair, focusing on both the macroeconomic perspective and technical charts to provide a short-, medium- and long-term breakdown. In the macroeconomic section, we will be looking at yield differentials and scenarios driving the price of EUR/USD and how developments in these could impact the EUR/USD currency pair. In the technical analysis section, we will look at critical levels of support and resistance, momentum and trending environments. We will also have a look at market positioning and sentiment for the EUR/USD pair.
EUR/USD Backdrop
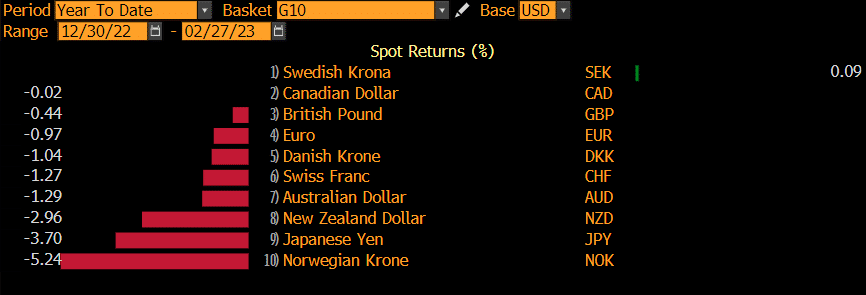
Year-to-date, EUR/USD is down around 1%, led by declines in February as the USD recovers from its retracement lows and tries to resume its core 2022/21 uptrend; the USD has been the driving force behind much of the underperformance across the G-10 currencies, but the EUR/USD pair hasn't performed as badly as the higher-beta currencies, such as the Australian, New Zealand Dollars and also the Norwegian Krone, which is down more than 5% this year.
Before we jump into the prevailing macro scenarios and take a look at the charts, we will quickly look at the history of the EUR/USD pair and why it is important in global FX markets.
EUR/USD History and Importance
The EUR/USD forex pair has a relatively short but still rich history as it traces the competitive nature of the relationship between the U.S. and Europe.
The Euro came into existence on 1 January 1999. Prior to this, there were a number of attempts to establish a stable, integrated European economy before the Euro was developed.
The European Economic Community (EEC), established in 1957, was the first attempt to integrate the economies of six nations (Germany, France, Italy, Belgium, the Netherlands, and Luxembourg), as well as to ensure the unrestricted flow of people, products, and services across national borders. When the EU was founded in 1993, the EEC was formally integrated into it, becoming the European Community (EC).
The 1979 adoption of the European Monetary System (EMS) saw the establishment of the EMS as a flexible exchange rate system. This arrangement, which was in place until 1999, reduced significant exchange rate movements, hence promoting monetary stability across Europe.
The European Currency Unit, a symbolic currency based on a basket of currencies from several European nations, served as the basis for the first valuation of the Euro versus the US dollar, and the Euro replaced a number of different national European currencies in 1999 when the EURUSD Forex pair was launched.
Why EUR/ USD Is Important
The currency pair represents the world's two most traded fiat currencies, with the two currencies representing two economic powerhouses, the EC and USA. Trading EUR/USD is extremely popular among forex traders the world over. The EUR/USD pair has the nickname fibre, a play on the slang term cable, which was used for the GBP/USD pair, which was named after the underwater cables that linked the UK and the US.
The US dollar is the national currency of the United States, but it is also the primary unit of value in ten other countries, including Ecuador, Panama, and East Timor.
Meanwhile, the Euro is the official currency of 20 of the EU's 27 member states, with that number set to rise by one when Bulgaria abandons the Bulgarian Lev (BGN) and joins the Eurozone in 2024. It is also accepted as legal tender in some European microstates.
Furthermore, the Euro and the IS Dollar are both international reserve currencies, as are the British Pound sterling (GBP), the Japanese Yen (JPY), and the Chinese Renminbi (CNY). This means that central banks around the world hold them as part of their foreign exchange (forex) reserves.
What Has Been Driving EUR/USD, and How Could These Impact EUR/USD Going Forward?
EUR/USD has been exposed to a wide range of macroeconomic and geopolitical risks over the last 12-24 months; the most noticeable of these has been Russia's invasion of Ukraine, the rapid acceleration to record high inflation in the region and globally, and historic ECB rate hikes in order to curtail sustained and sticky price pressures.
- Russia-Ukraine Invasion - EUR/USD didn't have a great start to 2022, having already set a major trend high at 1.2349 and dropping nearly 7% in 2021; Russia's invasion of Ukraine added substantial pressure on the Eurozone economy as the bloc was substantially impacted by halted energy supplies from Russia, which supercharged energy prices and thus inflation; the worsening geopolitical landscape saw traditional safe-haven currencies like the US Dollar outperform, exacerbating the Euro's weakness, due to its proximity to the war and reliance on Russian energy.
- Inflation - the subsequent impact on regional inflation was enormous, with Euro Area CPI going from 4.9 in December 2021 (already more than 2x the ECB's target) to a staggering 7.9% in March, with the Federal Reserve (Fed) having already begun its rate-hike campaign, the ECB's hawkish pivot wasn't enough to draw bullish attention to the common European currency.
- Recession - With inflation ripping to record highs, questions were raised on how robust the euro-zone economy actually was and whether it could withstand an inflation shock like this, especially on the back of an energy supply crunch; deep recessions for some of the euro-zone economies were priced in, with even the likes of Germany not avoiding a consensus recession event.
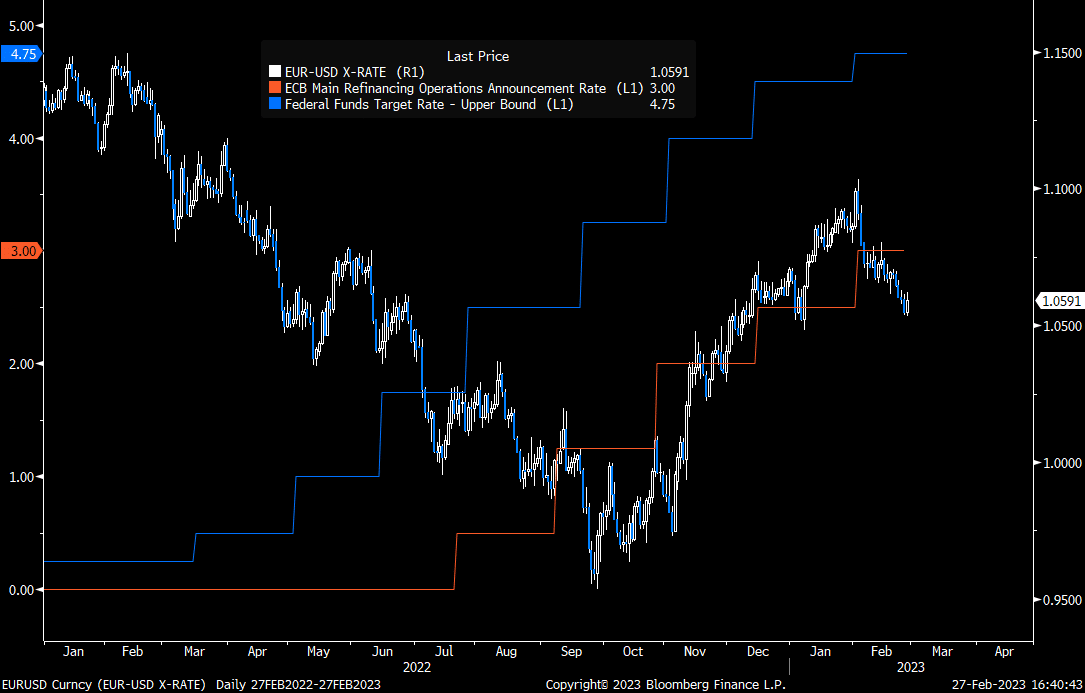
- The ECB - The ECB began its rate-hike campaign in July 2022, but by that point, the Fed had already hiked three times, a total of 1.5% in interest rate rises. The widening yield differential made it more attractive to hold the US Dollar, which had already been supported by a flight-to-quality inflow. Soon after the ECB hiked, the Fed delivered its second 75bps rate hike, substantially widening the interest rate differential. The US Dollar was the higher-yielding currency, so investors flocked to the USD to take advantage.
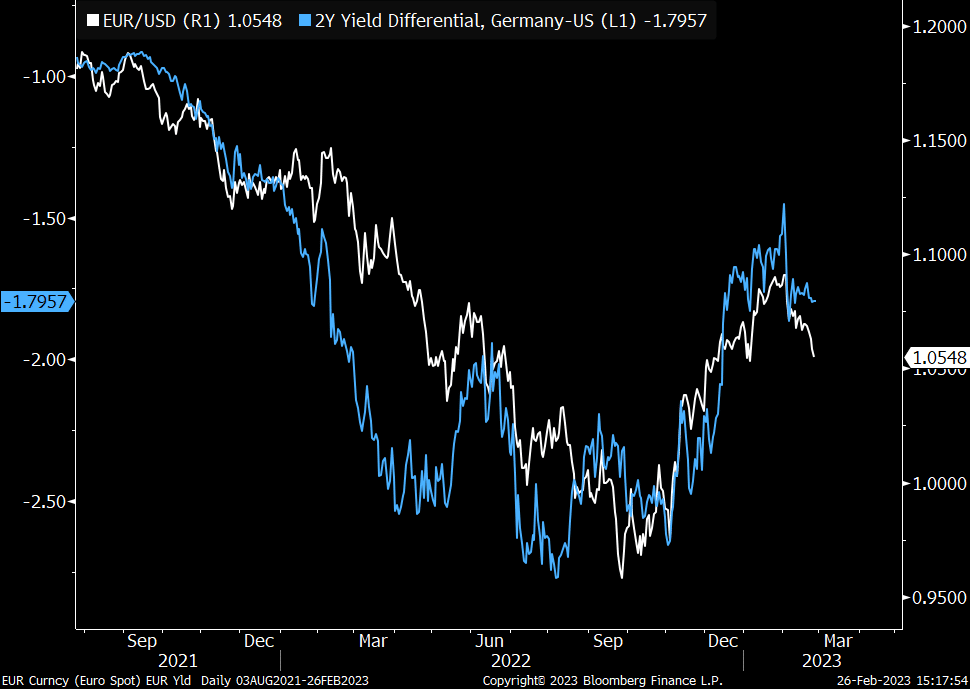
More recently, we've seen the tide change as the market prices in a Fed policy peak but expectations for the ECB to remain on its hiking path. The difference has allowed the yield differential to narrow again and has helped lift the EUR/USD currency pair from its lows at 0.9536.
Let's have a quick look at what has been impacting the currency more recently (from the back-end of 2022 onwards) and how these could impact the EUR/USD pair going forward:
- Looming Fed Rate-Hike Cycle Peak vs. ECB Continuation - Relative yield-differentials have become Euro-positive as the Fed approaches its terminal rate whilst the European Central Bank (ECB) still has to combat record high inflation, even though there are signs of it moderating. Market wagers on ECB rate cuts have also shifted to 2024, confirming the changing dynamic.
- Inflation to Growth - The dialling back of a severe EU recession has eased the pressure on the EUR. This is reinforced by recent data out of the EU, with noticeable strength returning in the bloc's Purchasing Managers Index data (PMIs) back to expansion territory (> 50). While not an outright sign of economic strength, it does suggest the EU may have avoided a recession.
- China Reopening - A lesser-known factor, but this contributes to the general risk environment as supply chain bottlenecks can ease and help reduce inflation. As this boosts risk appetite, the EUR/USD pair could definitely benefit.
- Geopolitics - The Russia-Ukraine conflict is now more of a local issue and less of a regional one since Europe has applied contingencies and gotten through the height of the energy supply issue. This is Euro-supportive.
- General Improvement in Risk Appetite - Using the S&P 500 as a proxy to measure improving/declining risk appetite, our chart work highlights a good correlation between stocks and EUR/USD. Both stocks and EUR/USD had bottomed in October/November 2022, and we've seen the same reversals downwards in February. So, could a sustained risk-on or risk-off trend be a bellwether for EUR/USD price action?
What Could Go Wrong?
- U.S. Inflation Peaks Later than Expected - If this is the case, the Fed will need to be more hawkish and maintain a rate-hiking path. This would re-fuel broader-based risk aversion, which is EUR/USD negative.
- U.S. Hard Landing Scenario - Currently not the base case, but if this becomes the consensus, then a risk-aversion trade could be aggressively reloaded, which is EUR/USD bearish.
- Further Escalation in the Ukraine-Russia Conflict
Macro Charts
EUR/USD vs. ECB and Fed Interest Rate Hikes
EUR/USD vs. 2YR German-US Yield Differential - Trend has been driven by a widening curve differential
Is EUR/USD's fate tied to risk-on and risk-aversion themes? The chart shows EUR/USD vs the S&P 500.
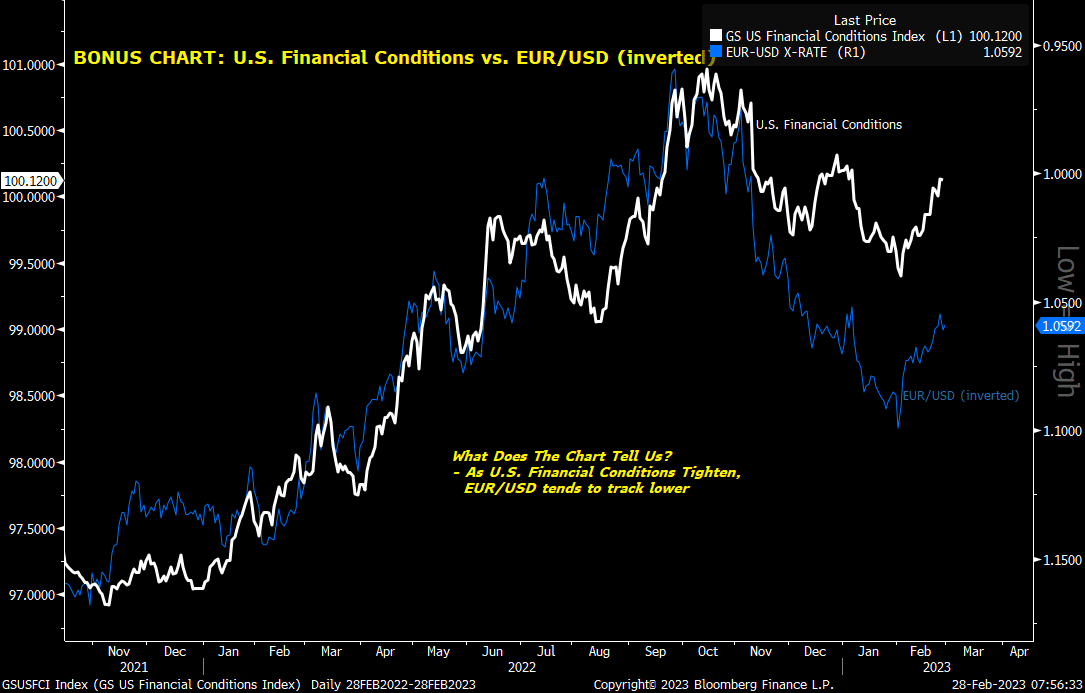
A chart that reinforces the EUR/USD's link to yield differentials and risk-aversion. EUR/USD has a strong negative link with tightening U.S. financial conditions, with the recent easing helping EUR/USD recover from lows. Breakout in U.S. financial conditions may see EUR/USD resume its strategic downtrend.
EUR/USD Seasonality and Positioning
Before we get onto some technical charts, we quickly want to go over some longer-term fundamental charts which may help understand the longer-term mechanics of EUR/USD.
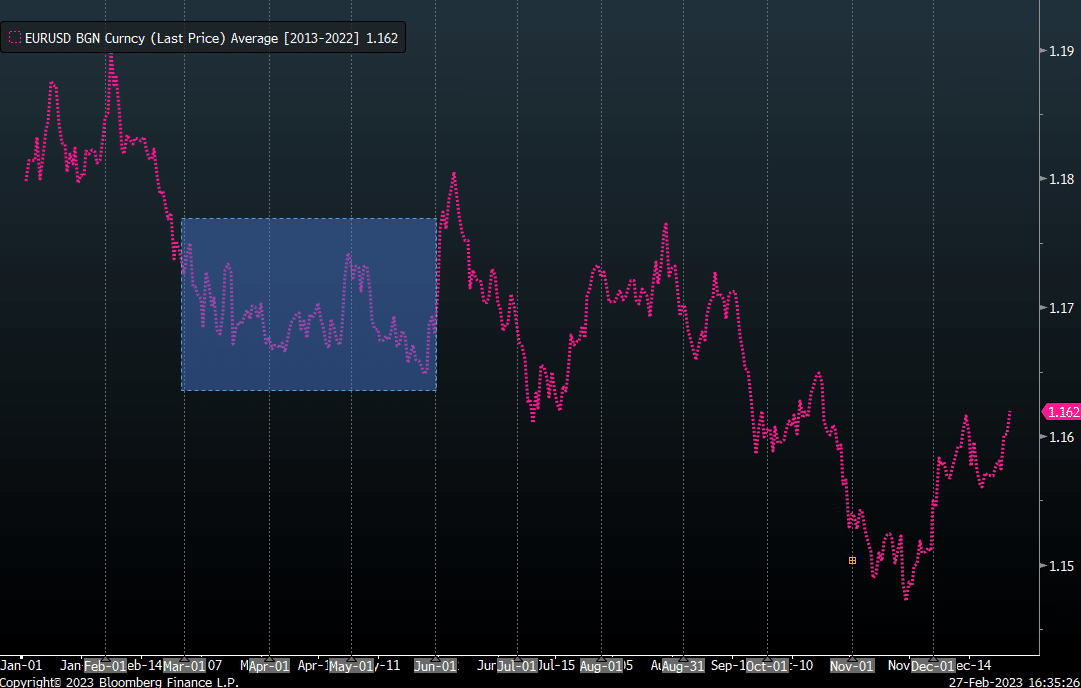
Seasonality (10-year) - March-May has been a rather choppy period for the Euro, but there is still a fairly clear bear tilt in the seasonality chart. So far in 2023, EUR/USD has conformed to the seasonality trend, selling off in February, but will this continue in the following months?
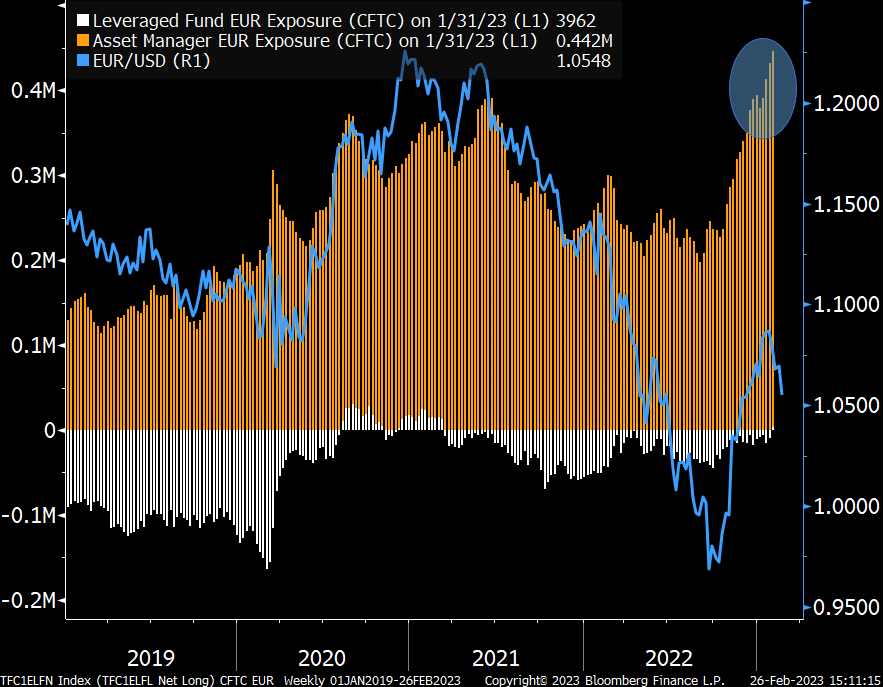
Positioning - While leveraged funds have been underweighting the Euro, asset managers have been compiling longs at an exponential rate over the last few months, and now medium-term positioning looks stretched on a historical basis. This jump in positioning has corresponded to the EUR/USD rally. However, if the positioning is stretched, is may no longer support a continued rally in EUR/USD.
EUR/USD Technicals
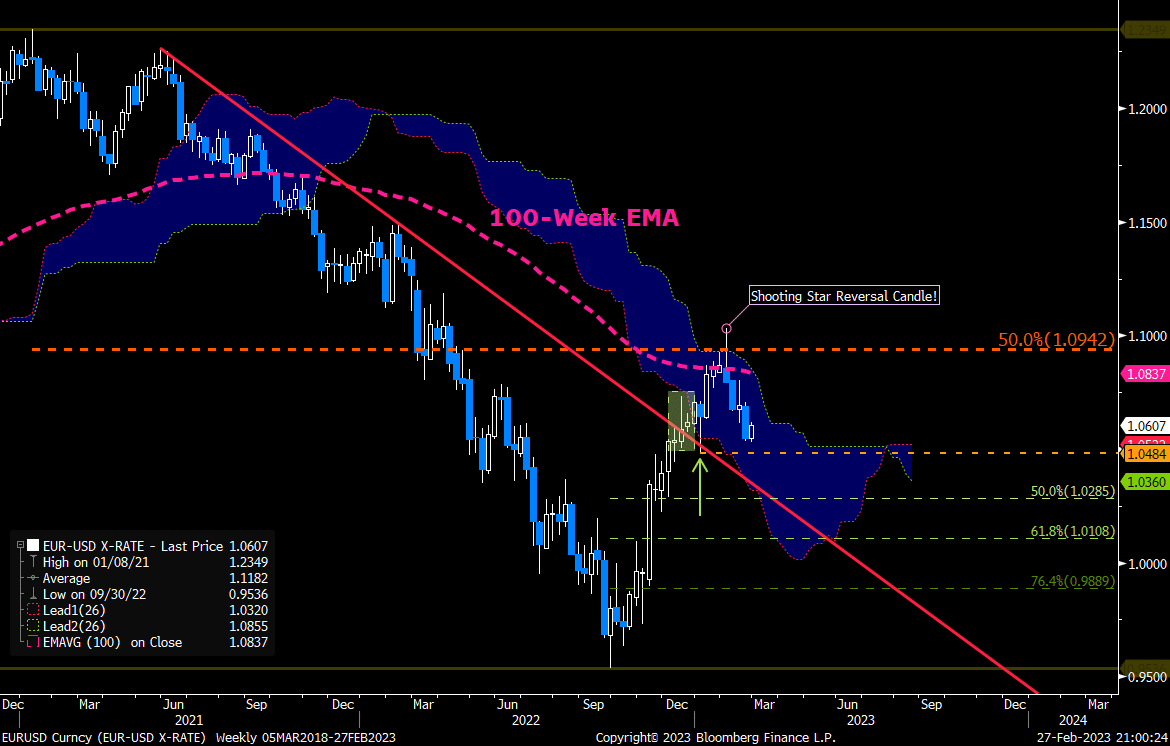
Starting with the longer-term weekly chart, prices have driven as much as 15% from their lows at 0.9536 (intraday low), breaking above the primary downtrend line originating from the June 2021 swing peak at 1.2266. The breakout of the trendline was affirmed by the retest at the start of 2023 (denoted by the green arrow), which helped escalate the pair into the 100-week Exponential Moving Average (EMA) and the critical Ichimoku Cloud Top. However, the Cloud Top has potentially rekindled strategic repositioning as the level acts as a long-term value line; as long as prices are not above the upper Cloud limit, the trend remains bearish, at least according to the Ichimoku model; more recently, we've seen prices snap lower, fading against the Cloud Top at 1.0942 to remains under the 100-week EMA; the fade, initiated by a classic weekly Shooting Star candlestick, has gravitated prices back to the daily 200-EMA and daily Ichimoku Cloud Base.
Despite the breakout of the bearish angle-of-attack, the bearish angle is still the prevailing trend and path of least resistance; a EUR/USD breakdown below 1.0285 would bolster topping risks along the weekly Cloud Top and 100-week EMA, unlocking potential down to 1.0108 and 0.9889. However, a breakout above the weekly 100-week EMA (currently at 1.0837) and long-term trend-midpoint at 1.0942 would embolden a stronger retracement phase, potentially up to 1.1185 and even 1.1390.
Major Price Pivot Levels of Interest
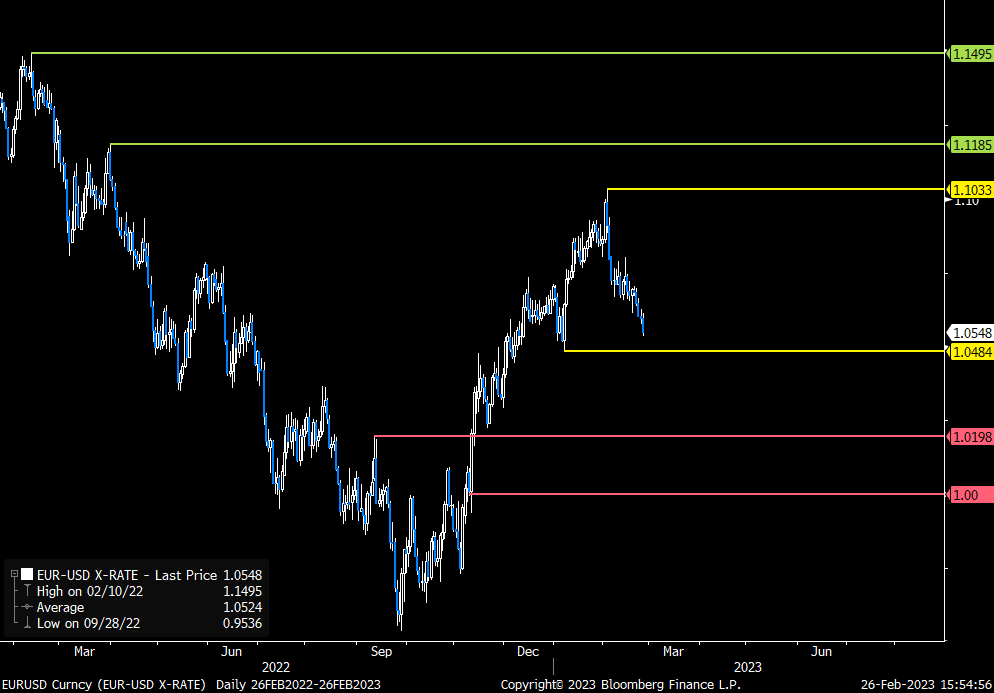
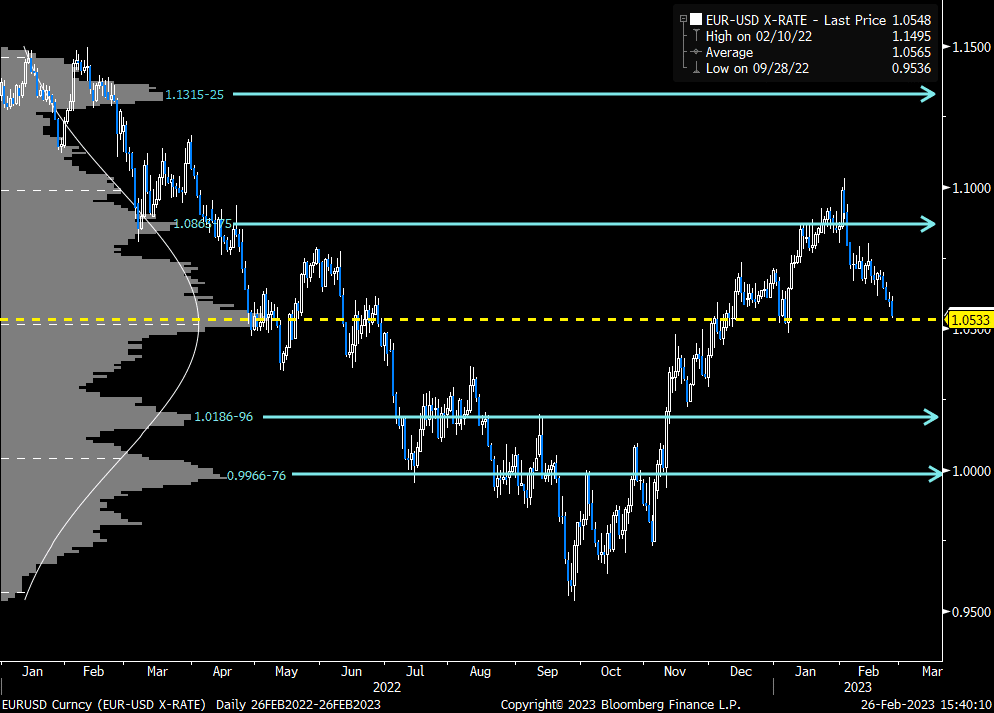
On the medium-term, the trend is bullish, with February's bearish correction potentially providing intermediate-term longs an opportunity to pick up some additional risk at cheaper levels and resume the October uptrend; prices are supported by a cluster of longer-term supports, most notably the 100/200-EMA's at 1.0549/34 and the Base of the Ichimoku Cloud; there is late support at 1.0484 (YTD low); this is quite interesting as a breakdown of the 200-EMA, Cloud Base could run the risk of being a head-fake (false-breakdown) as mkt picks up the dip along the cheaper 1.0484 level.
- Retracement has been fuelled by bearish price-MACD divergence through the rally from Nov-Jan; subsequent rollover has shifted the MACD into bearish territory too; as the price is still in an intermediate-term uptrend, this could reinforce value-hunting at these levels.
- In terms of price distributions since 2022, the mean "time-at-price" level is at 1.0533, which is near the spot price - it also supplements the Cloud Base and 200-EMA, adding weight for a technical recovery from current levels.
In the short-term, a breakdown below 1.0484 support would unlock corrective potential down to 1.0330 (200-Day SMA here!). While this would begin to constrain the medium-term uptrend, it doesn't entirely invalidate it.
EUR/USD Takeaways
EUR/USD is exposed to a multitude of risks over the next coming months, with the central focus on growth, jobs and inflation data. This will determine the Fed's and ECB's rate-hike path. Interest rate risks favour further EUR/USD upside as the Fed is seen to be approaching its terminal rate. At the time of writing, around 80 basis points of further tightening are priced in from the Fed, while more than 140 basis points of further hikes are priced for the ECB.
An improved risk appetite environment should also help the Euro maintain recovery as the USD is shunned on safe-haven outflow. Mix this with a more hawkish ECB and continued regional growth, and EUR/USD could blast past the weekly 100-EMA and Cloud Top to advance its intermediate bull trend.
However, should the Fed maintain a hawkish approach and counter-current market pricing, then the longer-term bear trend will retain a driving force, potentially shifting EUR/USD back to parity.
Top 5 Blogs
 Balance Guard