 Balance Guard
Price Action Trading Explained: How to Trade Profitably Without Indicators
Most beginner traders start their journey with charts overloaded with colourful indicators, oscillators, and technical tools such as Moving Averages, RSI, MACD, Bollinger Bands. These all promise clarity yet often create more confusion. Over time, many traders discover that the most reliable information has been price itself.
Price action trading focuses on reading the market directly through price movement, without relying on lagging indicators. By learning to interpret how buyers and sellers interact on a chart, traders can develop a clearer, more logical framework for identifying opportunities and managing risk.
In this guide, we will explain what price action trading is, how it works, and how beginners can use simple, proven techniques to trade with confidence and discipline.
Key Takeaways
- Analysis of Raw Price: Price action trading focuses on studying real-time price movement and market structure rather than relying on lagging mathematical indicators.
- Candlestick Interpretation: Traders analyse the "battle" between buyers and sellers by reading candlestick anatomy, where long wicks signify price rejection and bodies show trend strength.
- Market Structure & Levels: Success depends on identifying the broader market condition - uptrends, downtrends, or ranges - and trading near key support and resistance zones.
- The Power of Confluence: High-probability setups occur when specific patterns, like Pin Bars or Inside Bars, align with the dominant trend and established structural levels.
- Risk &Timeframe Discipline: Long-term profitability requires a strict 1% risk-per-trade rule and a focus on higher timeframes, such as Daily or 4-hour charts, to reduce market noise.
Table of Contents
What Is Price Action Trading?
Price action trading is a method of analysing financial markets by studying raw price movement rather than indicators derived from price. Instead of relying on mathematical formulas, traders focus on candlestick patterns, market structure, and key price levels to make trading decisions. This approach is sometimes referred to as “naked trading” because charts are kept clean, with minimal or no indicators.
The primary belief behind price action is simple; all market information (news, sentiment, institutional activity, and trader psychology) is ultimately reflected in price. While indicators often lag behind market movement, price action provides real-time insight into supply and demand. This makes it particularly attractive to traders who want a more direct and transparent way of understanding market behaviour. However, price action trading is not a shortcut to instant success. It requires patience, observation, and consistent practice to master.
How to Read Candlesticks and Market Structure
Candlestick Anatomy
Each candlestick represents four key data points: Open, High, Low, and Close. The candle’s body shows the distance between the open and close, while the wicks reveal how far price moved beyond those levels.
- Long bodies suggest strong buying or selling pressure
- Long wicks indicate rejection and failed attempts to push price higher or lower
- Small bodies and doji candles reflect market indecision
Understanding this “battle” between buyers and sellers forms the foundation of price action analysis.
Market Structure: Trends and Ranges
Market structure refers to how price moves over time. Most markets fall into three main conditions:
- Uptrend: Higher Highs and Higher Lows
- Downtrend: Lower Highs and Lower Lows
- Range: Price moving sideways between support and resistance
Identifying the current structure helps traders align their strategies with market direction, increasing the probability of success.
Support and Resistance Zones
Support and resistance are areas where price has historically stalled or reversed. These are not precise lines but zones where large orders often accumulate. Traders can identify these areas by observing previous highs, lows, and consolidation regions. When price approaches these zones, reactions are more likely to occur, making them important reference points for trade entries and exits.
Two Proven Price Action Trading Strategies
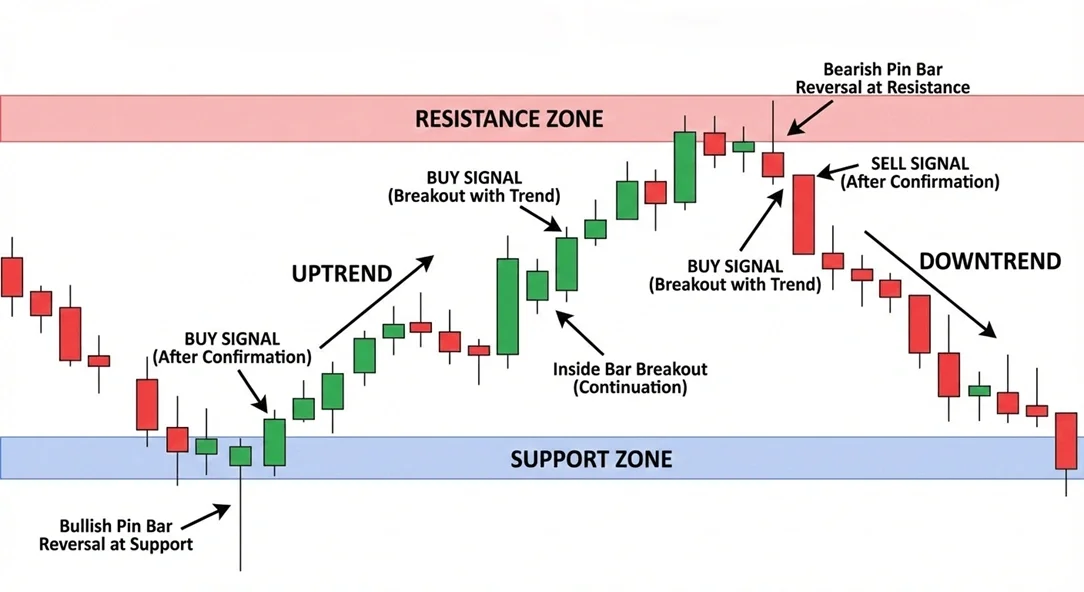
Strategy 1: The Pin Bar Reversal Strategy
A pin bar is a candlestick with a long wick and a small body, showing strong rejection of a price level.
How It Works
Price attempts to break through support or resistance but is rapidly rejected. This rejection suggests that one side of the market has lost control.
Entry Rules
- Wait for the candle to close
- Enter in the direction opposite to the long wick
- Prefer setups at major support or resistance zones
Exit Rules
- Stop-loss beyond the wick
- Take-profit at the next key structural level
- Aim for a minimum risk-reward ratio of 1:2
Common Mistakes
- Trading pin bars in the middle of ranges
- Ignoring the broader trend
- Entering before the candle closes
Strategy 2: The Inside Bar Breakout Strategy
An inside bar forms when a candle is completely contained within the range of the previous “mother bar.” This indicates temporary consolidation.
How It Works
The market pauses after a strong move, storing energy for a potential breakout.
Entry Rules
- Place a buy stop above the mother bar high for long trades
- Place a sell stop below the mother bar low for short trades
- Trade in the direction of the dominant trend
Exit Rules
- Stop-loss on the opposite side of the mother bar
- Profit target equal to the height of the mother bar
- Trail stops if momentum remains strong
Best Conditions
- Trending markets
- After strong impulsive moves
- Near key support or resistance
Confluence and Volatility: Reading High-Quality Signals
In price action trading, individual patterns should never be traded in isolation. Confluence is what transforms an ordinary setup into a high-probability opportunity. A pin bar or inside bar becomes significantly more reliable when it forms at a well-established support or resistance zone, along a major trendline, or in the direction of the dominant trend. These overlapping factors indicate that multiple groups of market participants are reacting to the same area, increasing the likelihood of a meaningful move. By contrast, patterns that appear in “no man’s land,” far from any key level, often lack follow-through and should be avoided.
At the same time, traders must learn to read the “body language” of volatility through candle size. Large, impulsive candles reflect strong conviction and aggressive participation from buyers or sellers, while small-bodied candles and doji formations signal hesitation and uncertainty. Recognising whether the market is acting decisively or indecisively helps traders judge when to commit and when patience is the better choice.
Risk Management for Price Action Traders
Risk management is the foundation of long-term trading success. Without it, even the best strategies will eventually fail.
The 1% Rule
Never risk more than 1% of your account on a single trade. This protects your capital during inevitable losing streaks.
Position Sizing
Calculate position size based on stop-loss distance and account balance, not emotions.
Risk-Reward Discipline
Target trades that offer at least twice the potential reward compared to the risk taken.
Dynamic Stop-Loss Placement
Price action naturally shows where a trade idea becomes invalid. Stops should be placed beyond key rejection points or structural levels.
Best Timeframes for Price Action Trading
Higher timeframes provide clearer signals and reduce market noise. For most traders, the most reliable charts are Daily and 4-hour. Lower timeframes such as 1-minute or 5-minute charts often generate false signals and emotional overtrading. Beginners benefit greatly from focusing on higher timeframes while developing consistency. Multi-timeframe analysis can also be useful, with higher charts defining trend and lower charts refining entries.
Trader Psychology and Discipline
Successful price action trading is based as much on mindset as on technical skill. Every candlestick represents collective human emotion: fear, greed, hesitation, and confidence. Learning to read this emotional footprint helps traders anticipate behaviour rather than react impulsively. One of the most common mistakes is entering trades before candle close. A setup is only valid once the candle has fully formed. Patience is essential. Simplicity is another key principle. If price does not present a clear story, staying out of the market is often the best decision. Maintaining a trading journal and reviewing past trades further strengthens discipline and self-awareness.
Common Price Action Trading Mistakes
Many beginners struggle due to avoidable errors:
- Trading every visible pattern
- Ignoring market structure
- Moving stop-losses emotionally
- Overtrading during low-quality conditions
- Chasing missed opportunities
Recognising and correcting these habits is critical for long-term development.
Is Price Action Trading Profitable?
Price action trading can be profitable, but only when applied with discipline, patience, and proper risk management. There are no guaranteed win rates or shortcuts. Most consistently profitable traders focus on high-quality setups, strict capital preservation, long-term consistency, and continuous learning. For most beginners, meaningful results require months of structured practice and evaluation.
Trading Tools and Platforms
A clean charting environment is essential for price action traders. Platforms that offer reliable execution, clear chart layouts, and flexible risk management tools help support disciplined trading. We encourage readers to use our free Hantec demo account to practise price action trading in real-time market conditions, helping you develop consistency and confidence before moving to a live account.
Conclusion
Price action trading offers a simple yet powerful approach to analysing financial markets. It works across Forex, Stocks, Indices, and Cryptocurrencies. It requires no paid indicators and provides direct insight into supply, demand, and market psychology. Indicators can serve as helpful reference tools, but price remains the ultimate source of truth. Indicators may offer a map, but price is the road itself. Successful traders learn to follow the road.
As a practical exercise, open a clean chart with no indicators and identify five pin bars that formed at clear support or resistance levels over the past month. Study how price reacted after each setup and record your observations.
With consistent practice and disciplined risk management, price action trading can become a reliable foundation for long-term trading development.
Frequently Asked Questions
What exactly is price action trading?
It is a method of analysing financial markets by studying raw price movement on a "naked" chart rather than using mathematical formulas or indicators derived from price.
Is price action trading better than using indicators?
While indicators often lag behind the market, price action provides real-time insight into supply and demand. However, indicators can still serve as helpful reference tools—price is simply considered the ultimate source of truth.
What are the best timeframes for this strategy?
Higher timeframes, specifically the Daily and 4-hour charts, are the most reliable because they provide clearer signals and reduce market noise compared to 1-minute or 5-minute charts.
Can beginners make money with price action?
It can be profitable, but it is not a shortcut to instant success. Meaningful results usually require months of structured practice, discipline, and proper risk management.
How much should I risk per trade?
A common rule is the 1% rule: never risk more than 1% of your account balance on a single trade to protect your capital during losing streaks.
Top 5 Blogs