 Balance Guard
The Ultimate Guide to Trading with the Ichimoku Cloud
The world of trading has countless discerning yet tactful strategies, and East Asia has made its fair share of glorious contributions to it. One of the prominent and efficient ones, 'Ichimoku Kinko Hyo' (commonly known as the Ichimoku Cloud), originates from Japan. Crafted by strategist Goichi Hosoda in 1930 and perfected through the 20th century, this condensation of market contexts into lines and clouds is a pretty solid indicator of a chance of rain or snow.
But what is Ichimoku Cloud in a tactical sense? This is the multi-line technical indicator that presents trends and momentum, along with the dynamic aspects of support and resistance at a single glance.
This art of trend following through Japanese technical analysis has proven critical in various traders' arsenal, often referred to as the 'pocketknife' strategy. In this piece, we are going to see the market through the cloud and learn all there is to decode for a safe trading experience.
Key Takeaways | The Ichimoku Insights:
- ✓ Ichimoku cloud structure and components
- ✓ How to configure and read the Ichimoku Cloud
- ✓ Ichimoku cloud strategies and signals
- ✓ Using Ichimoku in forex, crypto, and stocks
- ✓ Ichimoku cloud vs other indicators
- ✓ Does Ichimoku Cloud work? Validating the Ichimoku strategy
- ✓ Common mistakes to avoid with Ichimoku Kinko Hyo
The Ichimoku Cloud Components Explained
In a field like trading, where so many elements play a key role in success and failure, the Ichimoku Cloud takes pride in calling itself the "one-glance equilibrium chart". A culmination of "five lines", rather, the five components, work in tandem to create the right Ichimoku cloud settings while trading.
I. TENKAN-SEN | Conversion Line
SIGNALS: Key support and resistance levels, potential reversals
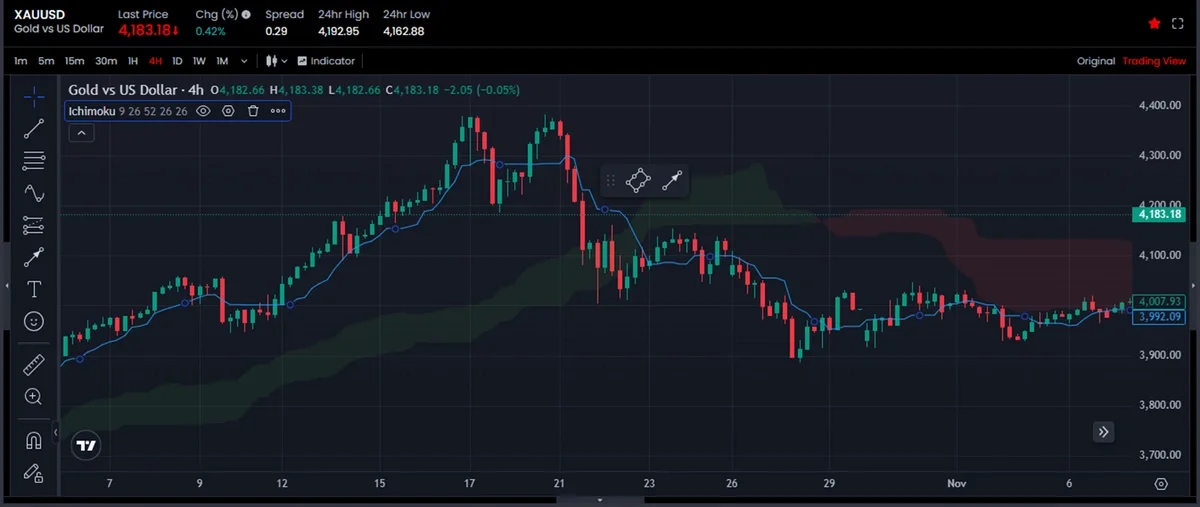
IN-PICTURE | The "Tenkan-San conversion line [BLUE]"
The tenkan-sen is a key starting point of the cloud, signifying a short-term trend that is calculated by adding the highest of highs and the lowest of lows over the last 9 periods. The result is divided by two, and the line showcases pivotal support and resistance levels, signalling potential reversals.
II. KIJUN-SEN | Base Line
SIGNALS: Support and resistance, trend changes, trailing stop-loss
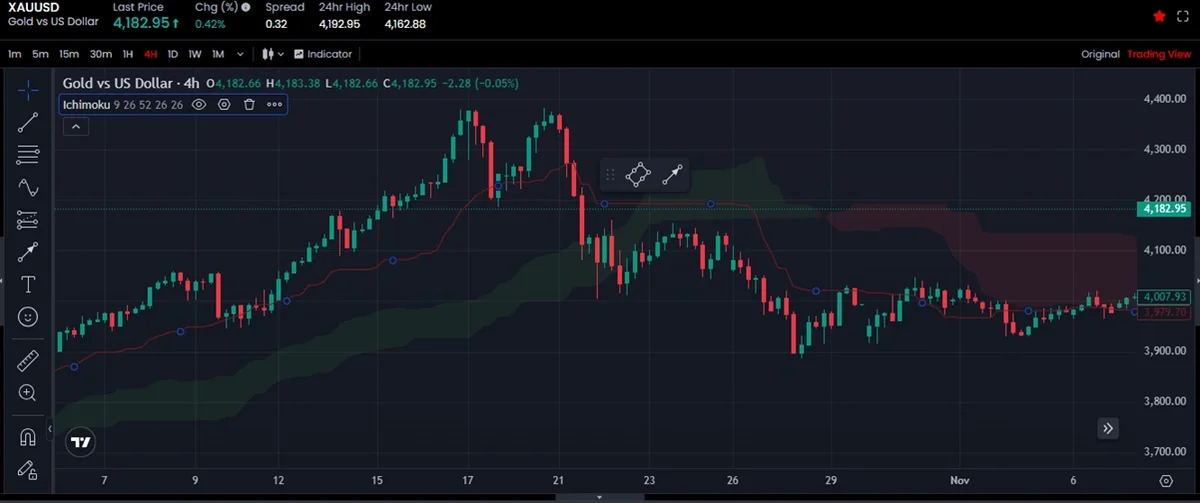
IN-PICTURE | The "Kijun-Sen base line [RED]"
While the rationale stays the same as tenkan-sen, the kijun-sen is the baseline that spans over the highest high and the lowest low of the past 26 periods. The longer trend duration helps draw a baseline that affirms the cloud in showcasing support and resistance while confirming changes in trend and keeping an eye out for a trailing stop-loss.
III. SENKOU SPANS | Leading Spans
SIGNALS | Areas of future support and resistance
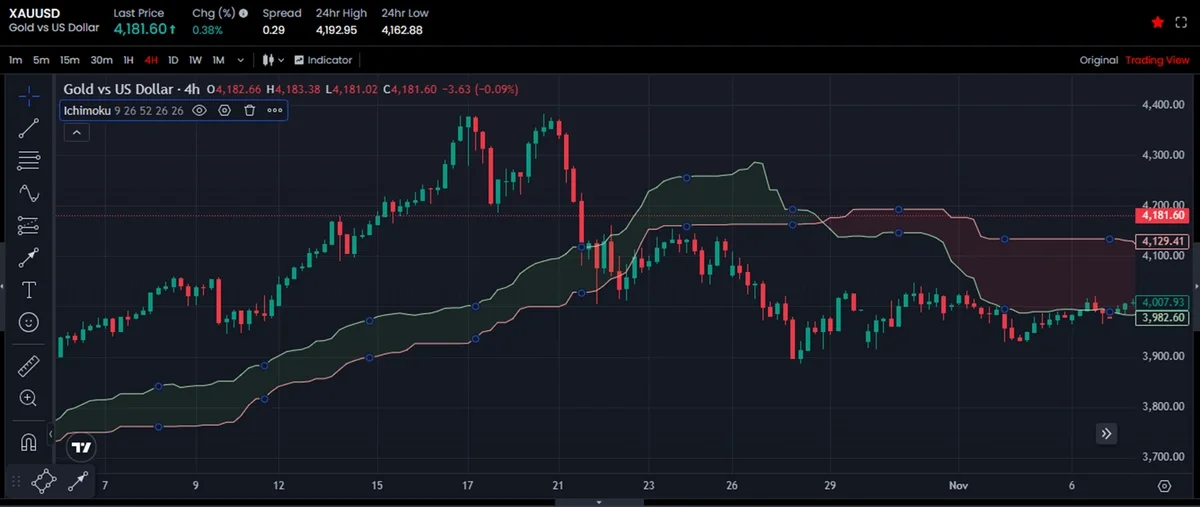
IN-PICTURE | The "Senkou Span A [GREEN]" and "Senkou Span B [RED]" forming the "Kumo Cloud"
Senkou spans can be construed as two edges of the Kumo, and they turn out to be the leading spans that showcase what's coming next on the trend.
But first, what is Kumo?
Kumo, or the Cloud, is the area between the two ends of Senkou Span [A & B]. Not only does it visualise the trend strength, it even signals zones of support, resistance, and volatility. A thicker Kumo means stronger support/resistance, and vice versa.
Senkou Span-A is the first leading span, calculated by adding tenkan-sen and kenjun-sen, dividing its result by two, and plotting it 26 periods ahead (future-first, right?). This is one side of the kumo, indicating future support and resistance.
Senkou Span-B, the other leading span, is derived by calculating the highest high and lowest low over the last 52 periods, divided by two, and plotted 26 periods ahead. This is key to bringing the past and future correlation together, completing the kumo and identifying areas of support and resistance.
IV. CHIKOU SPAN | Lagging Line
SIGNALS: Confirmation of trend when it sits above/below the price
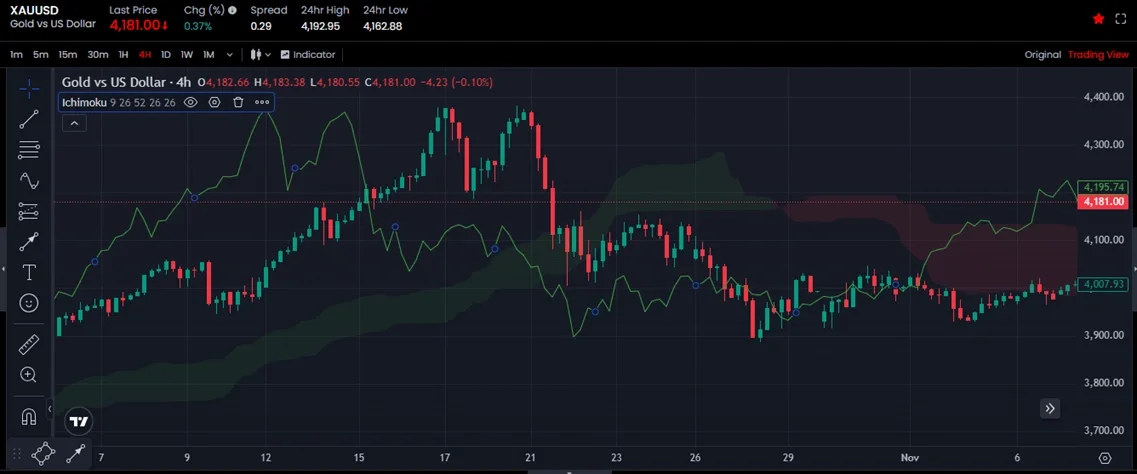
IN-PICTURE | The "Chikou Span lagging line [GREEN]"
The lagging span is the closing price of the current period, plotted 26 periods back on the chart to confirm a trend when it sits above or below the price.
These elements come together to form the very cloud that acts as both a trend filter and a dynamic support/resistance indicator. The price above the cloud indicates a bullish bias, while the price below is bearish. And in case you are wondering what the price indicates when it's inside the cloud, this is a sign of uncertainty or consolidation.
The cloud colour and slope indicate its momentum, with rising span A over span B suggesting a strengthening bullish trend, while a flat span B indicates consolidation and potential range-bound behaviour.
Now that we understand how Ichimoku cloud settings align the trends, let's learn how to configure and read it.
How to Configure and Read the Ichimoku Cloud
The Ichimoku Cloud can be simply set up by accessing its built-in indicator, labelled as "Ichimoku Kinko Hyo'" or "Ichimoku Cloud'" on the trading platform of your choice. Let's analyse the specifics for you to get started.
Default Period
Goichi Hosada concluded that the "(9, 26, 52) strategy" is the best suited for this result; however, this is a rendition of the old Japanese trading week, with 9 being the shortest and 52 being the longest. For someone using Ichimoku for the first time, the default strategy is a good place to start, but adjustments can come in handy based on timeframes being tested and asset behaviour.
Timeframes
When using Ichimoku cloud analysis, the most common timeframes are the day-to-day timeframe, which is ideal for swing trades and position bias. Traders can also choose 4-hour or 1-hour timeframes to monitor intraday trends and crossover setups. And for the long-term structural view and trend filtering, weekly timeframes fit the bill.
Market Conditions
Best in trending markets. Ichimoku cloud settings excel at showing trend direction and momentum. Less reliable in sideways/ranging markets. Expect more false breakouts in ranging markets and put additional filters to use. Now let's read the Ichimoku cloud by analysing pricing above, below and inside the cloud.
In the below examples, we read the XAUUSD chart, examining what different prices and clouds give the trend outlook.
Reading the Cloud and Price
The following examples illustrate how to read the XAUUSD chart based on the price's position relative to the cloud.
Price above Cloud → bullish bias.
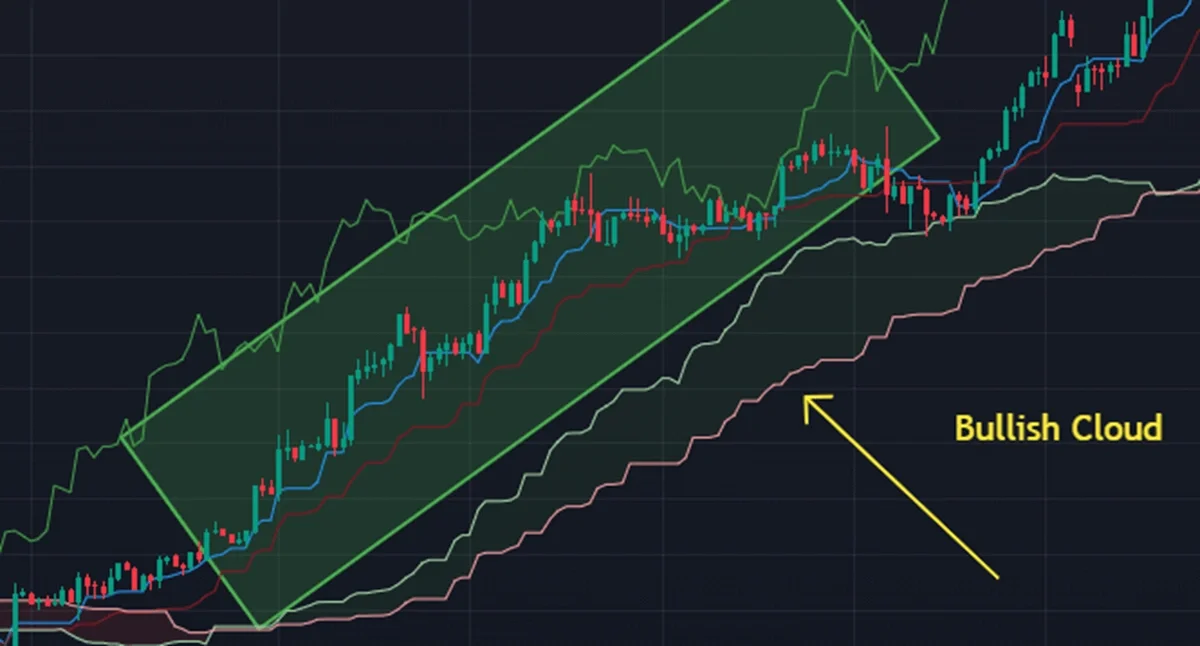
Look for bullish Tenkan/Kijun crosses and Chikou above the prior price for higher-probability entries.
Price below Cloud → bearish bias.
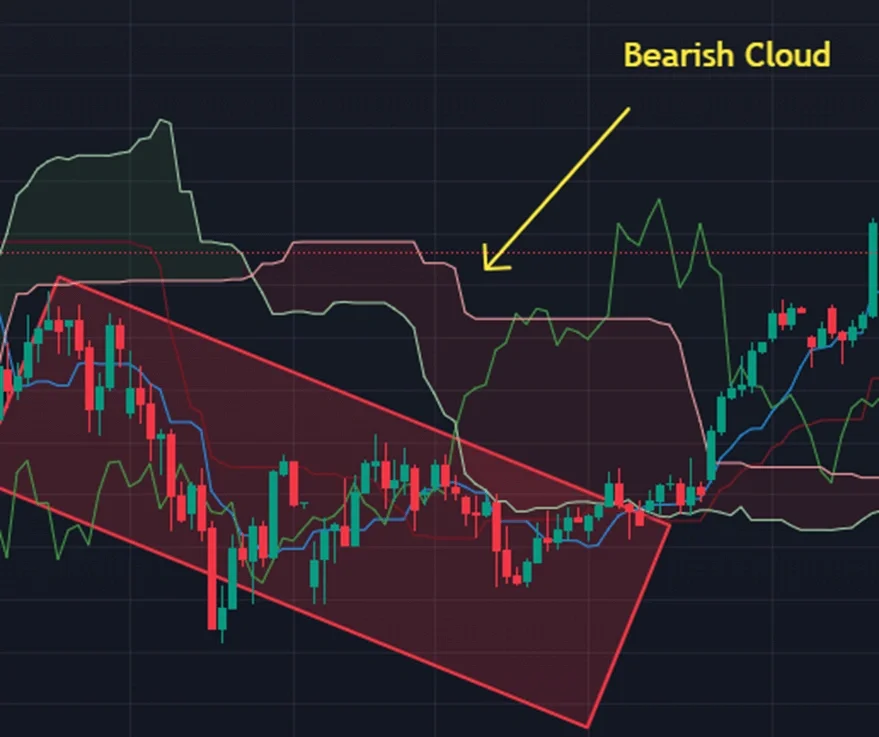
Seek bearish crosses and Chikou below the prior price.
Price inside Cloud → neutral / consolidation.
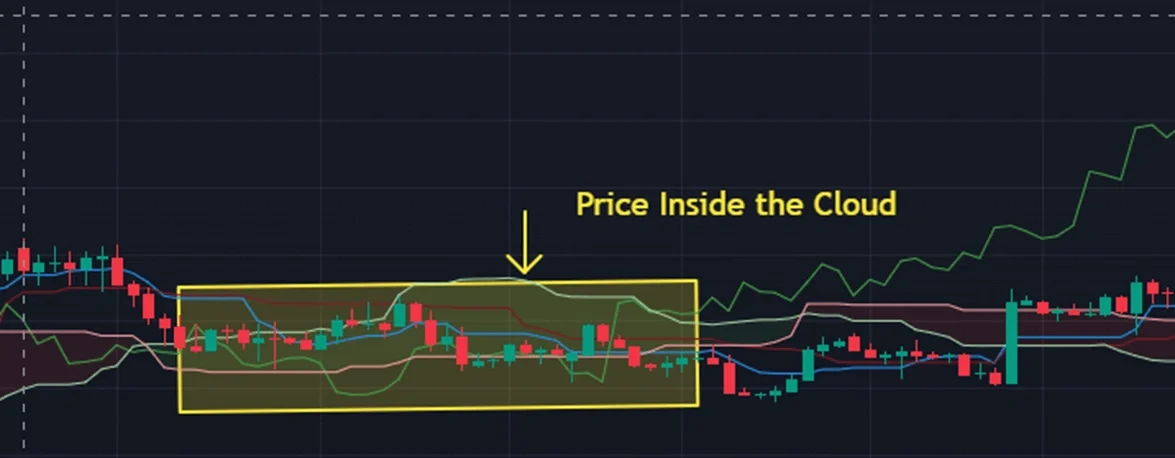
Wait for a clear breakout and confirmation before committing.
Flat Senkou Span B signals.
Potential range or upcoming decision zone — avoid aggressive trend trades there.
Chikou Span confirmation.
Only accept signals that align with Chikou — e.g., bullish entry when Chikou is above the price plotted 26 periods back.
Trading is a sport of support and resistance, which is why the Ichimoku cloud acts as the perfect lifeline to give you a bird's eye view, as they say, at a single glance.
Trading with the Ichimoku Cloud: Strategies and Signals
When dealing with the Ichimoku trading strategy, it's critical to get your plans right from the start.
- Start by defining the trend using price vs kumo and the two senkou spans.
- This can be fortified by seeking confirmation from the tenkan-sen and kijun-sen cross, the chikou span alignment, and volume or multi-timeframe agreement.
- Remember that risk comes with reward and defining risk via stop-loss relative to cloud boundaries, kijun, or ATR is key.
- Use position sizing that stays consistent with a fixed percentage risk for every trade.
Core Rules When Using Ichimoku Cloud
- "Bias:" Price > Cloud → bullish; Price < Cloud → bearish; Inside Cloud → neutral.
- "Entry (higher probability):" Tenkan/Kijun cross in the direction of Cloud bias + Chikou confirmation.
- "Kumo breakout:" Prefer retest confirmation; avoid breakouts into flat Senkou B zones.
- "Stops:" Kijun line, Cloud boundary, or ATR-based buffer.
- "Timeframes:" Use a higher timeframe for bias; a lower timeframe for execution.
Now that we have the ground rules sorted, let's dive into the strategies.
Strategy A | Baseline Strategy: Tenkan/Kijun Cross (with Cloud filter)
The Tenkan/Kijun cross is similar to a fast/slow moving average cross but contains additional price-profile information because the lines are midpoints of ranges, not simple averages.
Setup rules
- "Trend filter:" Price must be above Cloud for long entries (below for shorts).
- "Entry:" Bullish entry when Tenkan crosses above Kijun while both lines are above the Cloud.
- "Confirmation:" Chikou Span above price (26 bars back).
- "Stop-loss:" Place below Kijun or below the Cloud lower boundary for long trades.
- "Take-profit:" Use fixed risk:reward (1:2 or 1:3), trailing Kijun, or exit on Tenkan/Kijun bearish cross.
Strategy B | Kumo Breakout Strategy (Kumo breakout & retest)
The Kumo is dynamic support/resistance; breakouts through a thick Cloud carry more significance. To reduce false breakouts, wait for a test.
Setup rules
- "Entry signal:" Price breaks above (for long) or below (for short) the Cloud, ideally on strong momentum and volume.
- "Retest confirmation:" Wait for a retest of the Cloud boundary (Senkou Span line) — enter on bounce off Cloud (long) or rejection (short).
- "Chikou alignment:" Chikou should support the breakout direction (above price for bullish).
- "Stop-loss:" Just inside the Cloud or slightly beyond the opposite Cloud boundary.
- "Targeting:" Use measured moves (previous swing high/low) or trailing by Kijun.
Strategy C | Multi-Timeframe Ichimoku Confirmation
Multi-timeframe alignment increases probability and reduces noise-driven trades in fast markets.
Setup rules
- "Higher timeframe (HTF):" Determine trend on daily/4-hour. If HTF is bullish, only take long signals on the lower timeframe (LTF).
- "Lower timeframe:" Use Tenkan/Kijun crosses and Kumo breakouts for entries that align with HTF bias.
- "Chikou cross-check:" Ensure LTF Chikou does not contradict HTF structure.
Disclaimer: These strategy examples are for educational illustration only. They are not trading recommendations and may not be suitable for all traders. No indicator guarantees profitability.
These strategies emphasise how Ichimoku Cloud can work in different ways when applied to different situations. Now let’s look at the cloud’s application on different asset classes.
Applying Ichimoku Cloud Across Markets - Forex, Crypto, and Stocks
The Ichimoku Cloud turns out to be a nifty tool when trading across the different markets, let's have a look at three majors of them - forex, crypto, and stocks.
I. Ichimoku Cloud in Forex
Let's analyse the XAUUSD pair to see how the Ichimoku cloud stays in motion here.
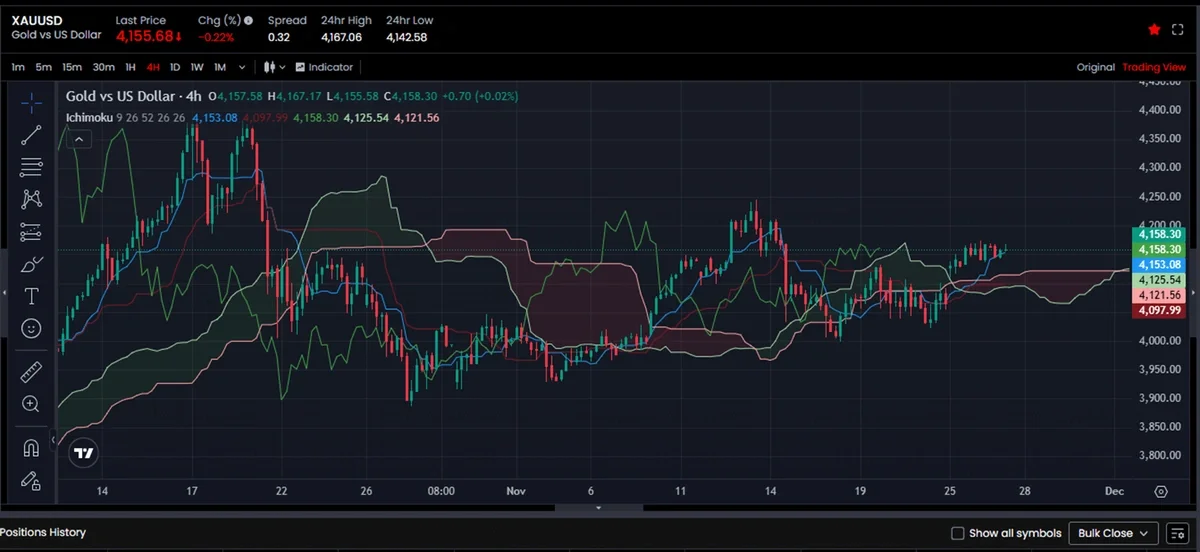
This is exactly how Ichimoku operates in real Forex market conditions. It forces a disciplined, confirmation-based approach that avoids emotional or premature trend assumptions.
Key Observations:
- Cloud as a trend filter — price emerging above a previously ranging Cloud.
- Tenkan/Kijun as momentum indicators — bullish momentum forming, but flatness showing caution.
- Chikou as confirmation — still neutral, keeping trend unconfirmed.
- Future Cloud projection — early bullish twist
- Market transitioning from consolidation to a potential bullish structure.
- Forex often exhibits sustained trends and reacts predictably to macro flows; Ichimoku captures ranges and trend changes well.
II. Ichimoku Cloud in Crypto
We will look at the BTCUSD pair to check if the Ichimoku cloud applies here.
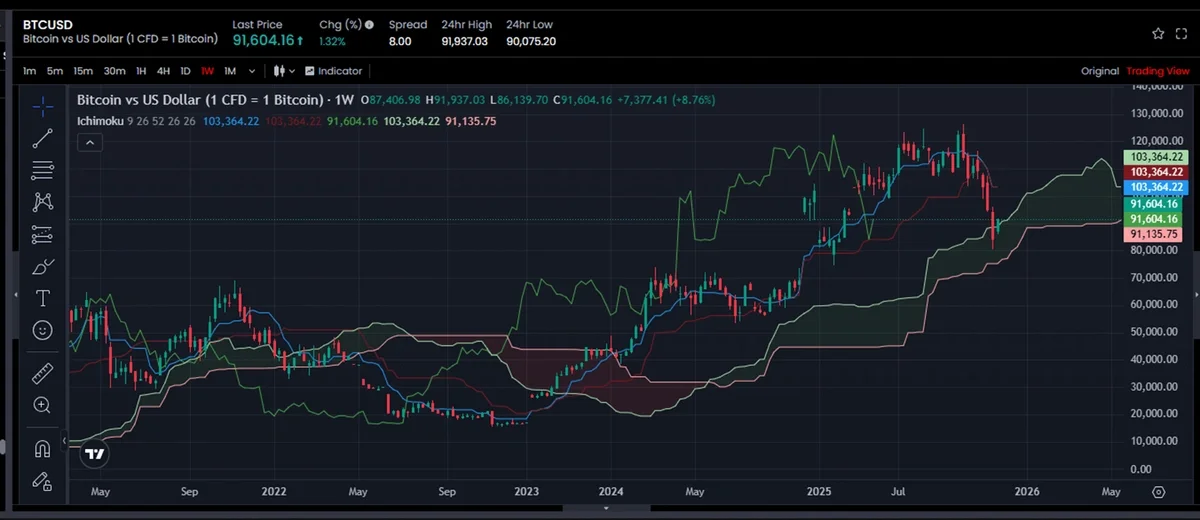
When trading a market of high volatility, it's critical to have your strategy right. Ichimoku cloud, being the future-first strategy, helps analyse the crypto market.
Key Observations
- Ichimoku quickly reveals regime shifts: clear bullish alignment during the rally; loss of conviction during the pullback into the Cloud.
- The Cloud’s thickness, Tenkan/Kijun slope, and Chikou placement together tell whether a crypto pullback is a healthy retracement or a likely trend reversal.
- Crypto requires stricter confirmation, higher-timeframe bias checks, and volatility-aware stops — all principles that Ichimoku naturally supports when applied with discipline.
III. Ichimoku Cloud in Stocks
Let's look at the Tesla stocks and infer how the Ichimoku Cloud works when dealing with stocks.
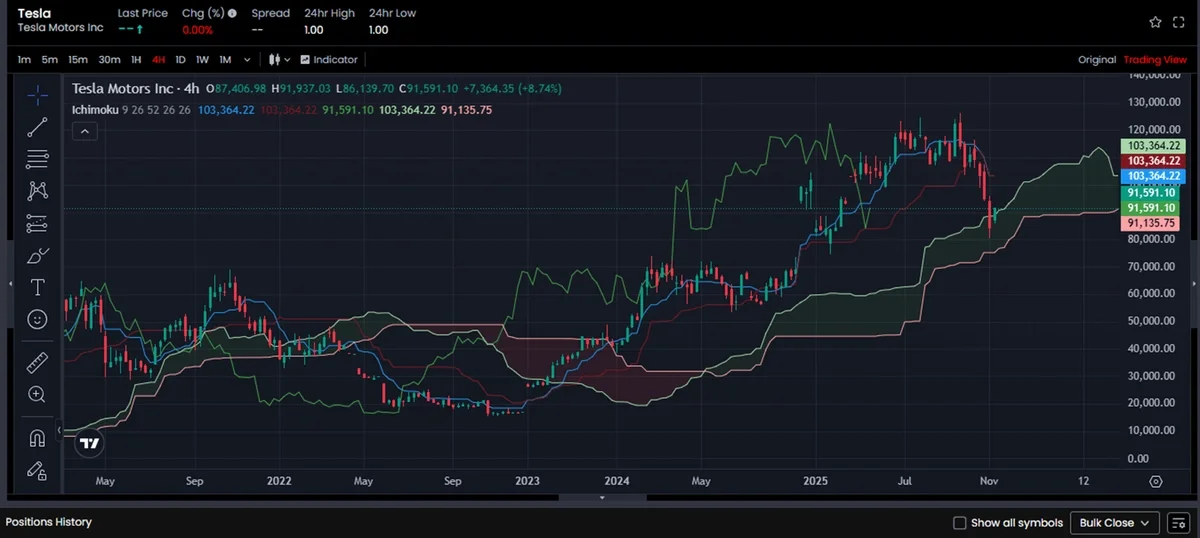
Used for trend identification and swing entries on liquid equities and indices is key when analysing stocks.
Key Observations
- Ichimoku provides a clear visual framework: trend filter (Cloud), momentum (Tenkan/Kijun), and confirmation (Chikou) combine to reduce guesswork.
- Cloud thickness and retests illustrate how support builds and how trend continuation becomes more probable once the Cloud holds.
- Equities require extra discipline due to gaps and event risk — the Ichimoku rules remain valid but must be applied with event-aware risk management, higher-timeframe confirmation, and appropriate stop sizing.
Comparing Ichimoku Cloud with Other Indicators
While the Ichimoku cloud is a full-stack trading pocketknife, it is worth exploring how it compares with other tools, specifically the moving average and oscillators like RSI and MACD. But beyond comparison, these tools are complementary to the Ichimoku cloud. This goes beyond Ichimoku Cloud vs Moving Average, RSI, and MACD.
| Feature | Ichimoku Cloud | Moving Average | RSI | MACD |
|---|---|---|---|---|
| Type | Multi-component system | Single/Multiple lines | Oscillator | Trend & momentum oscillator |
| Predictive ability | Leading elements (Senkou plotted ahead) | Reactive | Lagging (overbought/oversold) | Lagging (crossovers/histogram) |
| Best use | Trend, support/resistance, momentum | Trend smoothing & crossovers | Overbought/oversold, divergence | Momentum shifts & trend strength |
| Strength | Full market context in one view | Simple trend clarity | Timing in ranges | Momentum confirmation |
Points To Note
- Use RSI as an ancillary filter in ranging environments (avoid entry when RSI is extremely overbought/oversold against trend).
- Use MACD to confirm momentum strength on a higher timeframe.
- Use "moving averages" as redundancy for trend direction; a long MA (200) can sit alongside Ichimoku Cloud for macro bias.
How to Back test and Validate the Ichimoku Strategy
A combination of historical data and trend analysis, Ichimoku Cloud back testing is critical to see if it works.
Backtesting Checklist
- Define strategy rules clearly (entry, confirmation, stop, exit, risk per trade).
- Choose reliable data (clean price history, including spreads/slippage for forex/crypto).
- Select metrics: Win rate, Profit Factor, Expectancy, Maximum Drawdown, Sharpe Ratio.
- Walk-forward testing: Split data into in-sample and out-of-sample periods.
- Monte Carlo / position sizing stress tests: Assess robustness under variable trade sequences.
- Slippage and transaction cost modelling: Include realistic spreads and fees, especially for crypto and small-cap stocks.
The Ichimoku Cloud back testing can be done via Hantec WebTrader, MetaTrader, or Python. The results and outcomes can be evaluated using the win rate, profit factor, and Sharpe ratio. It's important to beware of typical back testing pitfalls; these include overfitting the parameters to the historical noise, ignoring slippage and overnight gaps, and not testing during different market conditions, be it bullish, bearish, or sideways.
REMINDER : Ichimoku Cloud works best with the right mix of confirmation signals and exhaustive and prudent risk management. Please plan your trades according to your risk tolerance and decode the signals with care.
Common Ichimoku Cloud Mistakes to Avoid (& Pro Tips to Follow)
In a tactical sense, Ichimoku Cloud seems to be backed by a good sense of trend analysis and works if used prudently, but it can lead to emotional trading. Here are some Ichimoku Cloud mistakes you must be wary of when using Ichimoku Kinko Hyo to trade.
Ichimoku Cloud Mistakes You Must Be Wary Of
- Overtrading in ranges: Treat signals inside or near a flat Kumo with caution.
- Ignoring Chikou Span: Taking entries that contradict Chikou often leads to failures.
- Misreading Cloud thickness: Thin Clouds are weak; treating them as strong S/R causes losses.
- Using defaults blindly: Some instruments and timeframes benefit from small parameter tweaks — but only after robust testing.
Ichimoku Trading Tips from Pro Traders
Now that you are wary of points to avoid, here are some Ichimoku trading tips from pro traders to get you started right:
- Combine volume or volatility filters (e.g., require higher-than-average volume on breakouts).
- Use "Kijun as a dynamic stop": A close below/above Kijun often signals trend exhaustion.
- Prefer "retest entries" on Kumo breakouts to reduce false signals.
- Trail stops to "Kijun", not Tenkan, for a less noisy exit process.
- Watch "flat Senkou Span B zones" as consolidation ranges that can produce choppy price action.
- Keep a rule for "partial profits": Lock in partial gains at the initial target and let the rest run with a trailing Kijun.
This is the Art of Mastering Market Vision
The masterful trading at its precise finest. In this Ichimoku Cloud guide, we learned how this compact, powerful way to read trends, momentum, and dynamic support/resistance in one visual system changes the way one can trade.
Strength lies in system thinking — combining Tenkan/Kijun cross signals, Kumo structure, and Chikou confirmation reduces guesswork and provides clearer trade decision rules. Best results usually come from disciplined application: define trend first, demand confluence, apply strict risk management, and validate strategies through robust back testing.
Start experimenting with and using the Ichimoku Trading Strategy Indicator on TradingView, or back test it via Python to see for yourself.
Sign up now and get started with $10,000 in demo account funds >>
With Hantec Markets, you can try your strategies, including the Ichimoku cloud, on a demo or put them to the test with a live account.
Trading with Ichimoku Cloud FAQs
1. What is the Ichimoku Cloud indicator?
The Ichimoku Cloud (Ichimoku Kinko Hyo) is a multi-line technical indicator that shows trend, momentum, and dynamic support/resistance at a glance via five components: Tenkan-sen, Kijun-sen, Senkou Span A & B (the Kumo) and Chikou Span.
2. What is the default Ichimoku settings and why (9, 26, 52)?
Default periods are 9, 26, 52, originating from a historical Japanese trading calendar; 9 = short, 26 = medium, 52 = long. These settings are the recommended starting point and should only be adjusted after robust back testing.
3. Which timeframe works best with Ichimoku Cloud?
Ichimoku is versatile: weekly/daily for structural bias and swing trades; 4-hour/1-hour for entries and intraday execution. Higher-timeframe alignment improves signal quality and reduces noise.
4. How to read the Cloud (Kumo) quickly?
- Price above Cloud = bullish bias.
- Price below Cloud = bearish bias.
- Price inside Cloud = neutral/consolidation.
Cloud thickness indicates support strength; thin Clouds signal fragile support.
5. What is the Tenkan/Kijun cross and how is it used?
Tenkan/Kijun is a fast/slow range midpoint cross. A Tenkan rising above Kijun while both are above the Cloud is a higher-probability bullish signal; the reverse indicates bearish bias. Use the Cloud and Chikou for confirmation.
6. What is a Kumo breakout strategy?
A Kumo breakout occurs when price breaks through the Cloud. Best practice: wait for a retest of the Cloud boundary and confirm with Tenkan/Kijun and Chikou to reduce false breakouts.
7. Does Ichimoku repaint or lag?
Senkou Spans are plotted ahead (leading), offering prospective support/resistance; Chikou is plotted back (lagging) as a confirmation. The indicator does not “repaint” past values, but some elements are inherently leading or lagging—understand which role each component plays.
8. Is Ichimoku suitable for Forex, crypto and stocks?
Yes. Ichimoku works across Forex, crypto and equities, but parameter sensitivity, volatility and event risk differ crypto needs stricter confirmation and volatility-aware stops; equities need event and gap risk management.
9. How to combine Ichimoku with other indicators (RSI, MACD, MAs)?
Use RSI for range timing, MACD for momentum confirmation, and long moving averages (e.g., 200 MA) for macro bias. Ichimoku gives context, oscillators, and volume act as filters.
10. How to back test an Ichimoku strategy?
Define precise rules (entry, confirmation, stop, exit), test on clean historical data, include spreads/slippage, use metrics (Profit Factor, Sharpe, max drawdown), and perform walk-forward and Monte Carlo analyses to avoid overfitting.
11. What are the most common Ichimoku mistakes to avoid?
- Trading inside a flat Kumo (overtrading ranges)
- Ignoring Chikou confirmation
- Treating thin Clouds as strong S/R
- Blind parameter changes without back testing
12. Can beginners learn Ichimoku quickly?
Yes — Ichimoku offers visual clarity for trend and S/R. Start with defaults (9,26,52), practise on a demo account, and emphasise higher-timeframe bias, strict risk management, and simple confirmation rules.
13. When should Ichimoku signals be ignored?
Ignore signals that contradict higher-period bias, occur inside a flat Senkou Span B zone, or lack Chikou confirmation. Also, avoid trading immediately before major announcements (earnings, central bank decisions).
14. Where to access the Ichimoku Cloud indicator?
Most platforms include it as Ichimoku Kinko Hyo or Ichimoku Cloud (TradingView, MetaTrader, Hantec WebTrader). Add the indicator and verify settings (9,26,52) before applying strategies.
Top 5 Blogs