Balance Guard
Introduction to Chart Patterns in Forecasting Future Price Movement
Technical Analysis Series for intermediate traders
Written by Aaron Akwu, Head of Education Hantec Markets
Chart patterns are an important part of technical analysis in the world of forex and stock trading. Technical analysis is the process of analysing historical market data, such as price and volume, to identify trends and patterns that can help predict future market movements.
Chart patterns are a specific type of technical analysis that involves looking at patterns in stock or currency charts to identify potential trading opportunities. These patterns can be formed by price movements over time, and they can help traders predict future market movements with a certain degree of accuracy.
Why Is Pattern Recognition Important for Traders?
Pattern recognition is an essential skill for traders, and it can make a significant difference in their success or failure. Let me explain to you why pattern recognition is so important in trading.
As a trader, you need to make informed decisions based on market trends, technical analysis, and other key factors. You have to analyse a vast amount of data, including price movements, trading volumes, and market sentiment. This is where pattern recognition comes into play.
By studying historical price charts, traders can identify patterns that may indicate a trend reversal, a breakout, or a continuation of the current trend. These patterns can help traders make better predictions and inform their trading decisions.
For example, a trader who recognizes a head and shoulders pattern may anticipate a price reversal and take a short position, while a trader who identifies an ascending triangle may expect a price breakout and take a long position.
Pattern recognition can also help traders manage their risk. By identifying patterns that signal potential losses, traders can avoid making risky trades and protect their capital. On the other hand, recognizing profitable patterns can help traders maximize their gains and increase their returns.
Types of Chart Patterns:
There are three main types of chart patterns: continuation patterns, reversal patterns, and bilateral patterns.
Continuation patterns:
They are chart patterns that indicate the stock or market is likely to continue its current trend. These patterns typically occur after a brief pause or consolidation period. Some common continuation patterns include the flag pattern, the pennant pattern, and the wedge pattern.
The flag pattern occurs when the price of the stock or market breaks out from a small rectangular pattern that resembles a flag. This indicates that the trend will continue in the same direction as before.
The pennant pattern is similar to the flag pattern, but it forms a small triangle instead of a rectangle. It indicates a temporary consolidation before the trend continues.
The wedge pattern is a series of converging trend lines that indicate a slowing down of the current trend before it continues in the same direction.
Reversal patterns:
Reversal patterns the other hand, indicate that the stock or market is likely to change direction. These patterns often occur after a long uptrend or downtrend. Some common reversal patterns include the head and shoulders pattern, the double top pattern, and the double bottom pattern.
The head and shoulders pattern is named for its resemblance to a head with two shoulders. It indicates that the stock or market has reached its peak and is likely to start declining.
The double top pattern occurs when the price reaches a high point twice but fails to break through. This indicates a potential trend reversal.
The double bottom pattern is the opposite of the double top pattern, indicating that the stock or market has reached a low point twice but failed to break through, signalling a potential reversal.
Bilateral patterns:
Bilateral patterns don't have a clear indication of trend continuation or reversal. These patterns can be symmetrical, such as the triangle pattern, or asymmetrical, such as the rectangle pattern. These patterns typically indicate a period of uncertainty in the market, and traders and investors must wait for more information before making a decision.
Trend Lines
Trend lines are an important tool used in technical analysis to identify and track the direction of a trend in the forex market. A trend line is a straight line that connects two or more price points on a chart. These price points are typically swing highs or swing lows that represent significant levels of support or resistance.
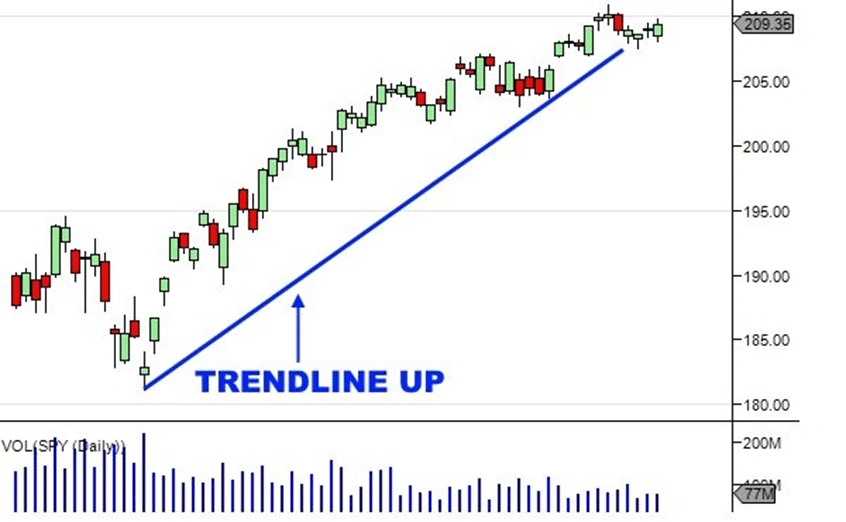
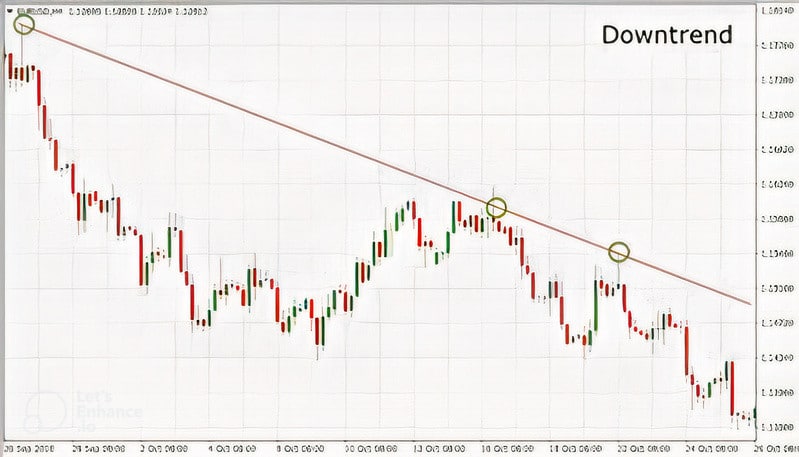
As a chart pattern, a trend line can be used to determine the overall trend of a currency pair. If the trend line is sloping upwards, it indicates a bullish trend, while a downwards sloping trend line suggests a bearish trend. Traders can use trend lines to identify potential entry and exit points in the market, as well as to set stop loss and take profit levels.
To draw a trend line, traders first need to identify two or more significant swing highs or swing lows on a chart. These points should be as far apart as possible while still forming a clear line. The trend line is then drawn by connecting the two points and extending the line outwards to the right of the chart.
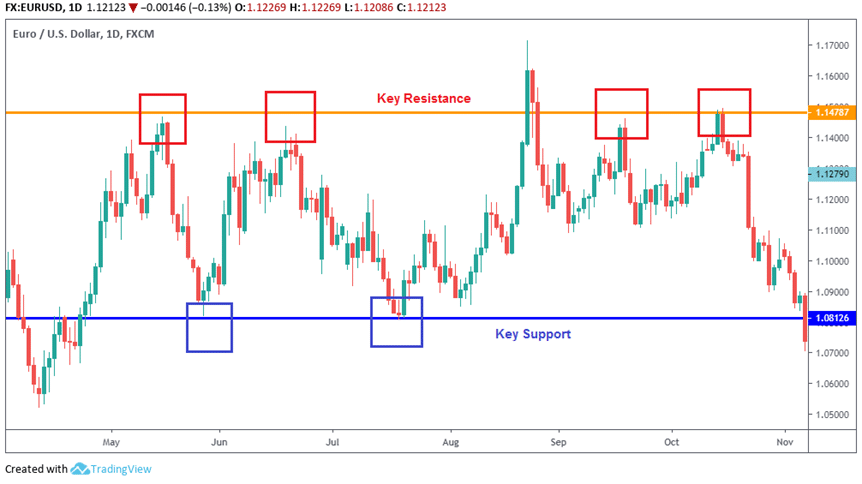
Once a trend line has been drawn, traders can use it to identify potential areas of support or resistance. In an uptrend, traders may look to buy near the trend line as a potential support level. In a downtrend, traders may look to sell near the trend line as a potential resistance level.
Types of Trends:
There are three main types of trends that occur in the forex market: uptrend, downtrend, and sideways trend.
- Uptrend occurs when the price of a currency pair is consistently increasing over time. This means that the currency is becoming stronger and more valuable compared to the other currency in the pair. Traders who identify an uptrend will typically look for buying opportunities, hoping to profit from the continuing rise in price.
- Downtrend occurs when the price of a currency pair is consistently decreasing over time. This means that the currency is becoming weaker and less valuable compared to the other currency in the pair. Traders who identify a downtrend will typically look for selling opportunities, hoping to profit from the continuing drop in price.
- A sideways trend occurs when the price of a currency pair is moving within a relatively narrow range, with no clear direction, either up or down. In this type of market, traders will often look for opportunities to buy at the lower end of the range and sell at the higher end, hoping to profit from the fluctuation in price.
- Uptrend occurs when the price of a currency pair is consistently increasing over time. This means that the currency is becoming stronger and more valuable compared to the other currency in the pair. Traders who identify an uptrend will typically look for buying opportunities, hoping to profit from the continuing rise in price.
Head and Shoulders
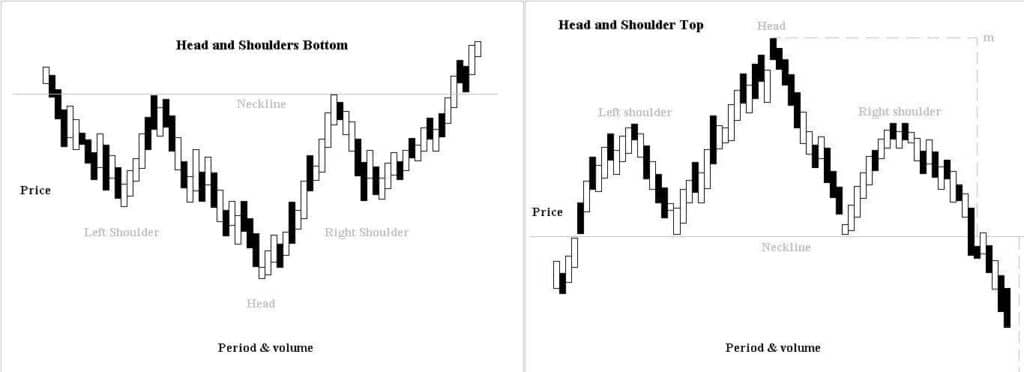
When it comes to forex trading, "head and shoulders" is a term used to describe a popular technical analysis pattern. This pattern is typically used to predict a reversal of a downtrend in the price of a currency pair.
The "head and shoulders" pattern is a type of continuation pattern, which means that it often occurs in the middle of a larger trend. In the case of a downtrend, the "head and shoulders" pattern typically forms after a significant price drop, followed by a short-lived upward trend, before resuming the overall downtrend.
The pattern is characterized by three peaks, with the middle peak being the highest. The two outer peaks are referred to as the "shoulders," while the middle peak is called the "head." The neckline of the pattern is formed by drawing a line connecting the two low points between the shoulders and the head.
A bullish continuation pattern occurs when the price breaks through the neckline, and traders often use this as a signal to buy the currency pair, expecting the price to continue rising. The pattern is typically confirmed when the price rises above the high point of the middle peak.
Many traders use price charts to identify patterns like the "head and shoulders" pattern. By studying the stock chart patterns and identifying these patterns, traders can gain a better understanding of the current market conditions and make informed decisions about when to buy or sell a currency pair.
Double Top
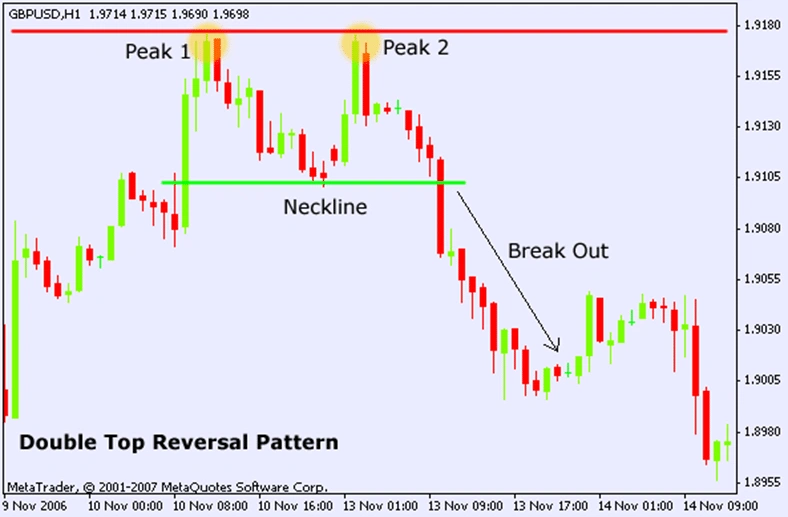
The double top pattern is one of the most common chart patterns in forex trading. It is a bearish reversal pattern that signals the end of an upward trend and the beginning of a downward trend. Traders use this pattern to identify potential selling opportunities.
In a double top pattern, the price chart forms two peaks that are roughly equal in height. The first peak occurs during an uptrend and is followed by a temporary pullback. The second peak forms when the price tries to reach a new high but fails, creating a resistance level.
Once the second peak is formed, the price usually begins to move downwards, breaking through the support level that was established during the pullback. This signals the end of the uptrend and the beginning of a new downtrend.
Traders can identify a double top pattern by looking for two high points that are separated by a pullback. The pullback should be at least 10-20% from the highest point. Once the second peak forms, traders can enter a short position with a stop loss above the second peak.
Double Bottom
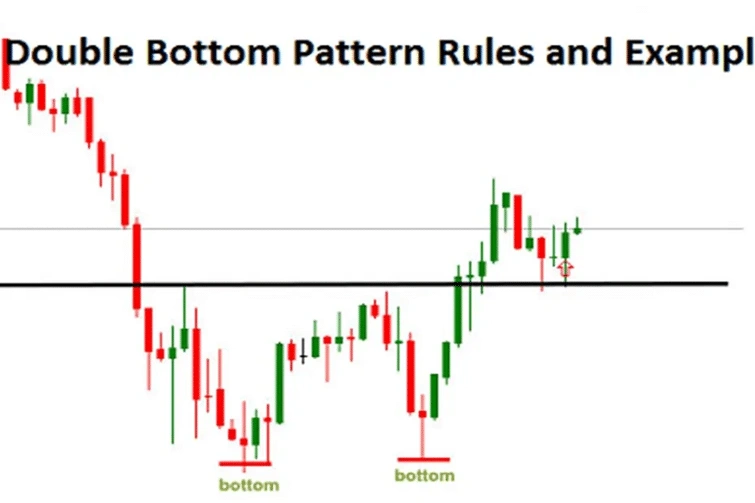
The double bottom pattern is one of the most popular reversal chart patterns used by forex traders. It is formed when the price of a currency pair drops to a support level, bounces back up, then falls again to test the same support level. If the support level holds and the price bounces up again, forming a "W" shape on the chart, traders may interpret this as a potential bullish signal.
The double bottom pattern is considered a bullish reversal pattern because it signals that the currency pair has reached a bottom and may start an upward trend. Forex traders often use this pattern to identify potential buying opportunities, as they anticipate that the price may continue to rise after the second bounce off the support level.
It's important to note that while the double bottom pattern is one of the most popular trading chart patterns, it should be used in conjunction with other technical analysis tools and indicators to confirm the validity of the signal. Traders may also want to consider other factors such as market conditions and news events that may affect the price of the currency pair.
Rounding Bottom
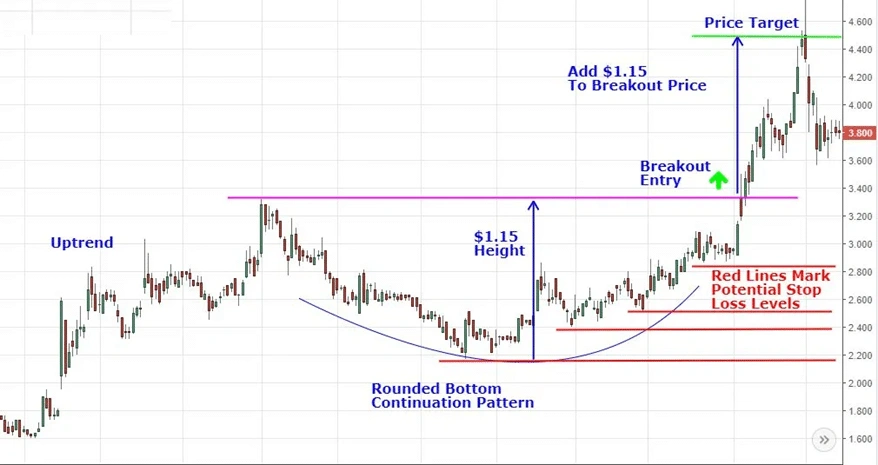
In trading, chart patterns are often used to identify potential price movements and make trading decisions. One such pattern is the rounding bottom pattern, also known as a saucer bottom or a bowl.
The rounding bottom pattern is a reversal chart pattern that is formed after a downtrend. It looks like a bowl or a "U" shape and indicates a potential shift in the prevailing trend. The pattern is formed by a gradual decline in prices, followed by a period of consolidation, and then a gradual increase in prices.
Traders often use this pattern to forecast future price behaviour, as the rounding bottom suggests that the downtrend may be coming to an end and a new uptrend may be starting. This can provide an opportunity for traders to enter long positions and ride the new uptrend.
It's important to note that while the rounding bottom pattern can be a reliable indicator, it should not be relied on solely. Traders should always consider other factors such as support and resistance levels, as well as market sentiment, before making trading decisions.
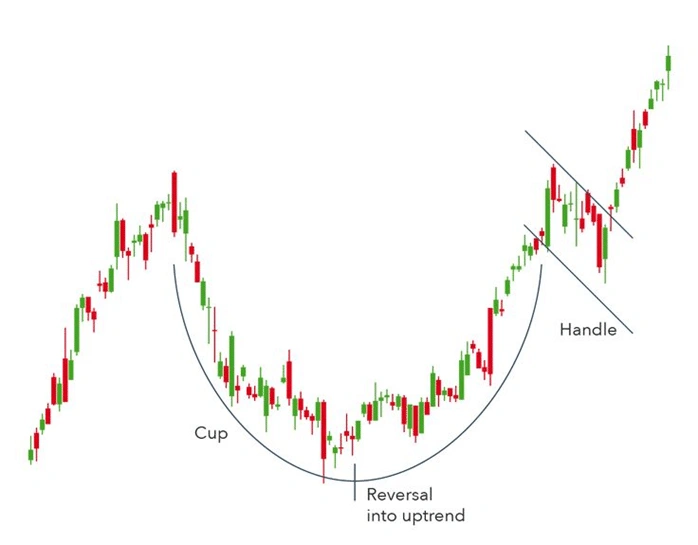
Cup and Handle
Technical analysts use a variety of chart patterns to analyse price movements and predict future market trends. One such pattern is the cup and handle pattern, which is a popular continuation price pattern.
The cup and handle pattern is characterized by a cup-shaped formation in the price chart, followed by a smaller handle-shaped formation. The cup portion of the pattern shows a gradual rise in prices, followed by a slight dip before the handle portion begins.
Traders look for this pattern because it can indicate a continuation of the previous price trend. If the cup and handle pattern is formed after an uptrend, for example, it suggests that the price will continue to rise after the handle portion is complete.
To confirm the pattern, traders often look for a break above the resistance level formed by the top of the cup. Once the price breaks through this level, it is seen as a signal to buy and hold the currency, anticipating a further price increase.
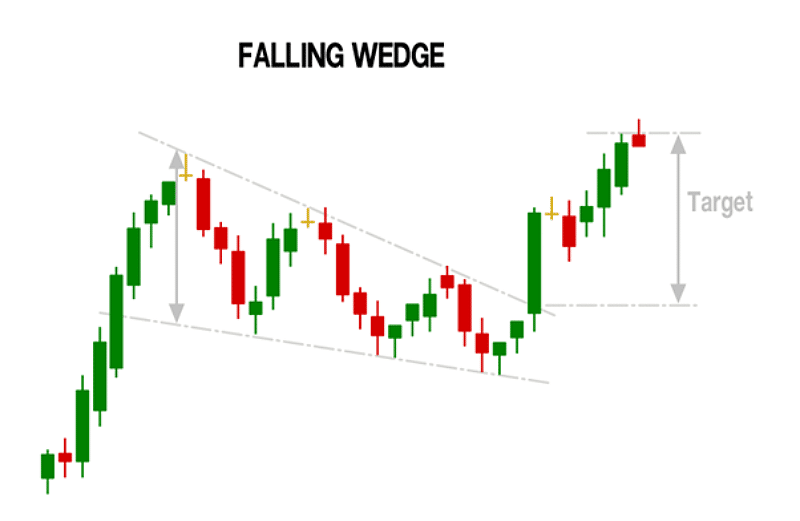
Wedge Patterns
The wedge pattern is one of the most commonly used chart patterns in technical analysis. The wedge pattern is created by drawing two trendlines, one connecting the lower highs and the other connecting the lower lows. The trendlines converge towards each other, creating a wedge-like shape on the chart.
The wedge pattern is a popular indicator among forex traders because it provides a clear signal that the downward trend is likely to reverse. When the price breaks out of the wedge pattern, it typically signifies a shift in market sentiment, with buyers taking control of the market.
Traders typically look for two types of wedge patterns: the rising wedge and the falling wedge. The rising wedge is formed when the price consolidates between two upward sloping trendlines, indicating that the market is losing momentum and a reversal is likely. Conversely, the falling wedge is formed when the price consolidates between two downward sloping trendlines, indicating that the market is likely to reverse its downward trend.
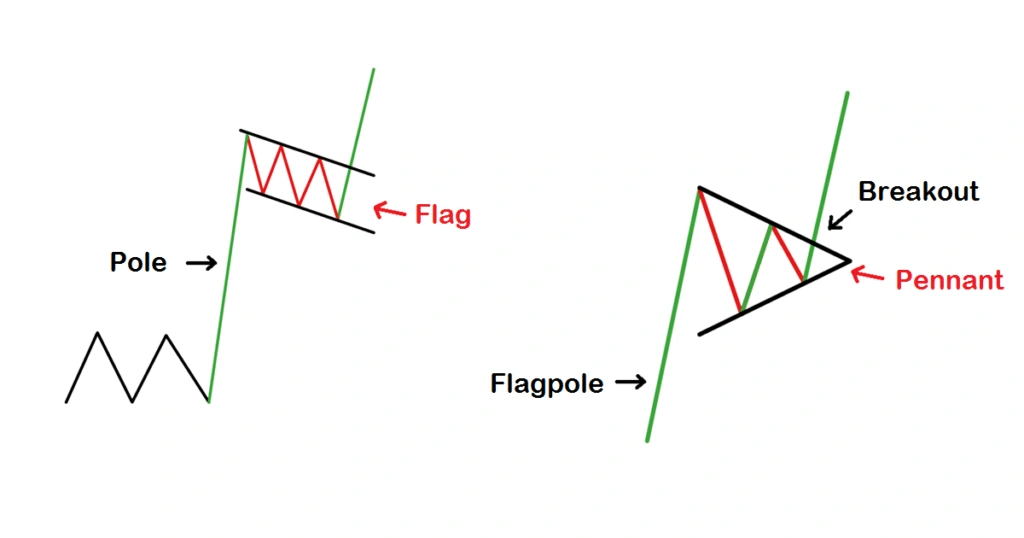
Pennant or Flags
In trading, the pennant or flags pattern is a popular chart pattern used by traders to identify potential trend reversals or continuations. This pattern is formed when the price of an asset consolidates after a strong move in a prevailing trend, creating a small symmetrical triangle that looks like a pennant or flag.
The pennant or flags pattern is a powerful tool that traders use to determine the direction of the market trend. When this pattern appears on a chart, it indicates a temporary pause or consolidation in the market before the price continues in the same direction as the prevailing trend. In other words, it's a continuation pattern.
Traders can use the pennant or flags pattern to enter the market when the price breaks out of the consolidation zone. Typically, a breakout occurs in the direction of the prevailing trend, signaling that the trend is likely to continue.
On the other hand, a failure of the price to break out of the pattern could signal a trend reversal. This occurs when the price breaks out of the pattern in the opposite direction of the prevailing trend, indicating a shift in market sentiment.
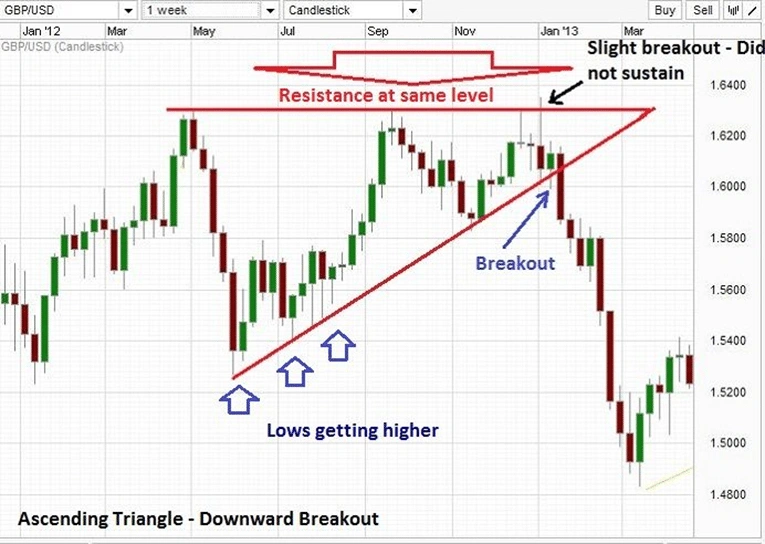
Ascending Triangle
An ascending triangle pattern is a commonly used technical analysis tool in forex trading that can help traders make informed decisions about when to enter or exit a trade. It is a bullish pattern that forms when the price of a currency pair is moving upwards and is bound by two trend lines - a horizontal resistance line and a rising support line.
To identify an ascending triangle pattern, traders look for a series of higher lows that form the rising support line and a horizontal resistance level that is tested several times but not broken. As the price continues to rise and approach the resistance level, traders will often look for a breakout above the resistance line as a signal to enter a long position.
However, it's important to keep in mind that the breakout may not always occur, and the price could also break down from the support line, leading to a potential sell-off. Traders should also look at other indicators and perform a thorough analysis before making any trading decisions.
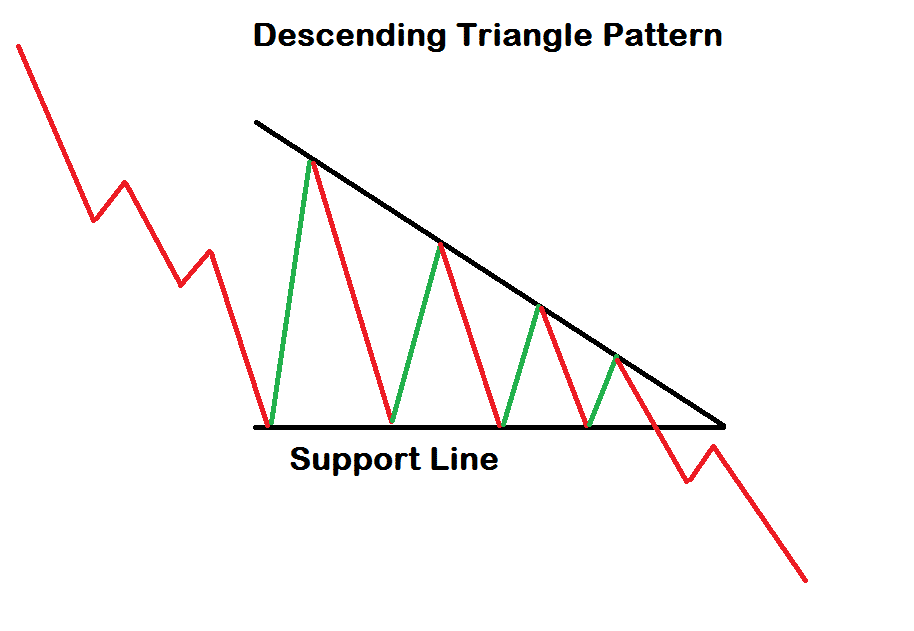
Descending Triangle
The descending triangle pattern is a bearish chart pattern that is formed when the price of a currency pair reaches a support level multiple times, creating a horizontal line, while the highs of the pair create a downward-sloping trend line. This pattern suggests that the bears are gaining control over the market and the price may continue to fall.
Traders usually look for a break below the support level, which would confirm the bearish trend and signal a potential opportunity to sell the currency pair. The target price for this pattern is usually calculated by measuring the height of the triangle from the highest point to the support level and projecting that distance downwards from the breakout point.
It's important to note that not all descending triangles lead to a bearish trend, and traders should always use other indicators and analysis techniques to confirm their trades.
Symmetrical Triangle
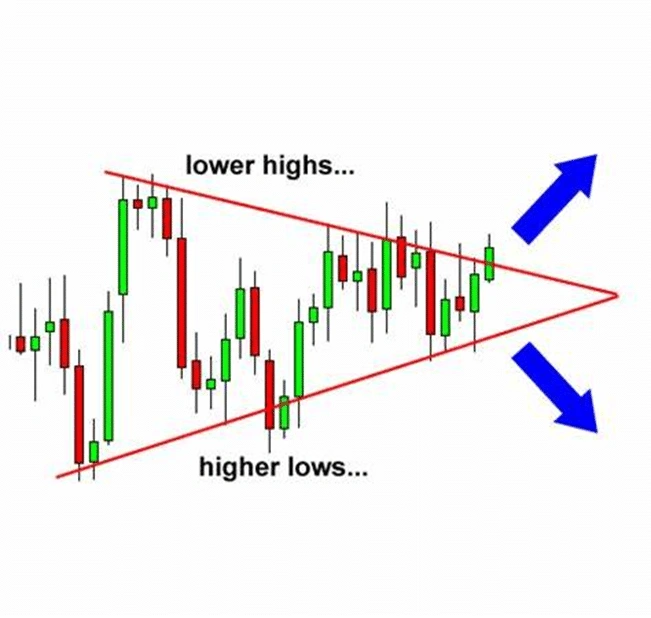
The symmetrical triangle pattern is a technical analysis pattern that appears on price charts in the Forex market. It is called a "symmetrical" triangle because it has a series of higher lows and lower highs that form two converging trend lines, making the triangle shape symmetrical.
The pattern typically forms during a period of consolidation in the market, where buyers and sellers are more or less evenly matched in terms of their activity. This results in a series of higher lows and lower highs as the price oscillates between support and resistance levels. As the pattern continues to form, the trend lines gradually converge towards each other, indicating that a breakout may be imminent.
When a breakout occurs, it is usually in the direction of the trend that existed prior to the formation of the triangle pattern. For example, if the price was in an uptrend prior to forming the symmetrical triangle, then the breakout is likely to be upwards. Conversely, if the price was in a downtrend, then the breakout is likely to be downwards.
Traders can use the symmetrical triangle pattern to help identify potential trading opportunities. They may wait for a breakout to occur and then enter a trade in the direction of the breakout. They may also use other technical indicators or fundamental analysis to confirm their trading decisions.
It's important to note that not all symmetrical triangles will result in a breakout, and not all breakouts will be successful. Traders should always use risk management techniques to protect their capital and manage their trades accordingly.