The world of trading is known for its fast-paced, adrenaline-fueled niche that attracts individuals with a taste for quick thinking. This niche requires traders to make quick decisions and act on them promptly: Boom-and-Crash indices.
If you’re intrigued by navigating through rapid market movements and seizing opportunities, this guide is for you. We explore the complexities of boom-and-crash trading and detail an effective trading strategy to help you navigate this volatile market.
What are Boom & Crash Indices?
Before diving into a trading strategy, let’s understand the mechanism. These indices are synthetic instruments designed to mimic the price movements seen in real-world markets, but with a programmed twist. They offer accelerated price action characterised by rapid spikes and sudden price movements (or crashes).
The strategy revolves around specific, expected events within the Boom 1000, Boom 500, Crash 1000, or Crash 500 Indices. Boom-and-crash traders aim to profit by taking advantage of this intense volatility.
| Index | Default Trend | The “Event” | Typical Strategy |
|---|---|---|---|
| Boom Market | Selling (Slow Drop) | Bullish Spike | Buying (Wait for the Spike) |
| Crash Market | Buying (Slow Rise) | Bearish Crash | Selling (Wait for the Crash) |
The indices are immune to fundamental economic factors and rely solely on technical analysis.
Trading Dynamics of Boom & Crash Indices
Crash trading is not for the faint of heart. Wild price swings can unfold within minutes. To navigate this successfully, traders must rely on technical analysis tools. The environment requires experience, as quick decision-making is paramount. Unlike trading stocks or other securities, this market’s structure makes deep knowledge of technical indicators absolutely crucial.
Strategies for Boom & Crash Trading
Successful boom and crash traders typically employ one of the following methodologies:
- Trend Following: Identifying the broader market trends and trading in the slow direction.
- Spike Catching (Reversal): The most popular trading strategy. Traders identify momentum exhaustion using technical indicators to anticipate sudden price movements.
Sample Chart Analysis: Predicting a Boom 1000 Spike
This strategy involves anticipating a spike using technical indicators like the Relative Strength Index (RSI).
Goal: Identify where bearish momentum is exhausted to predict the bullish spike.
| Indicator | Signal | Interpretation |
|---|---|---|
| Relative Strength Index (RSI) | Price makes a Lower Low, but RSI makes a Higher Low (Bullish Divergence). | Selling pressure is fading despite prices continuing to drop. This signals an imminent boom event. |
| MACD | The MACD line crosses above the Signal line (Bullish Crossover). | Confirms the shift in momentum from bearish to bullish. |
A disciplined trader enters a Buy position immediately after confirmation, aiming to catch the vertical spike.
Practical Walkthrough: 15-Minute RSI Divergence Setup
This step-by-step walkthrough outlines a disciplined setup for trading Boom 500.
Risk Management: 1:2 Risk-Reward Ratio (R:R)
| Step | Action | Justification |
|---|---|---|
| 1. Identify Trend | Check the Hourly (H1) chart to ensure you aren’t trading against a massive bearish trend. | Context reduces the probability of a setup failing immediately. |
| 2. Spot Divergence | On the M15 chart, wait for Price to create distinct Lower Lows while the RSI (14) creates Higher Lows. | This serves as the primary entry trigger. |
| 3. Entry | Enter a Buy position immediately after a candle closes confirms the divergence. | Ensures you are in the market before the volatility kicks in. |
| 4. Set Stop-Loss | Place the Stop-Loss Orders just below the lowest low of the divergence structure. | This defines your maximum risk and serves to protect your capital. |
| 5. Set Take-Profit | Set the Take-Profit at double your risk distance. | This ensures that substantial profits are realised and maintains long-term profitability. |
Backtesting and Performance Example
A simulated backtest of this M15 RSI Divergence strategy on Boom 500 over a 6-month period yielded the following data:
| Metric | Result | Insight |
|---|---|---|
| Total Trades | 85 | |
| Winning Trades (W) | 41 (48.2% Win Rate) | |
| Losing Trades (L) | 44 (51.8% Loss Rate) | |
| Net Profit Factor | 1.48 | Profitable despite a lower than 50% win rate, confirming that high R:R ratios are effective. |
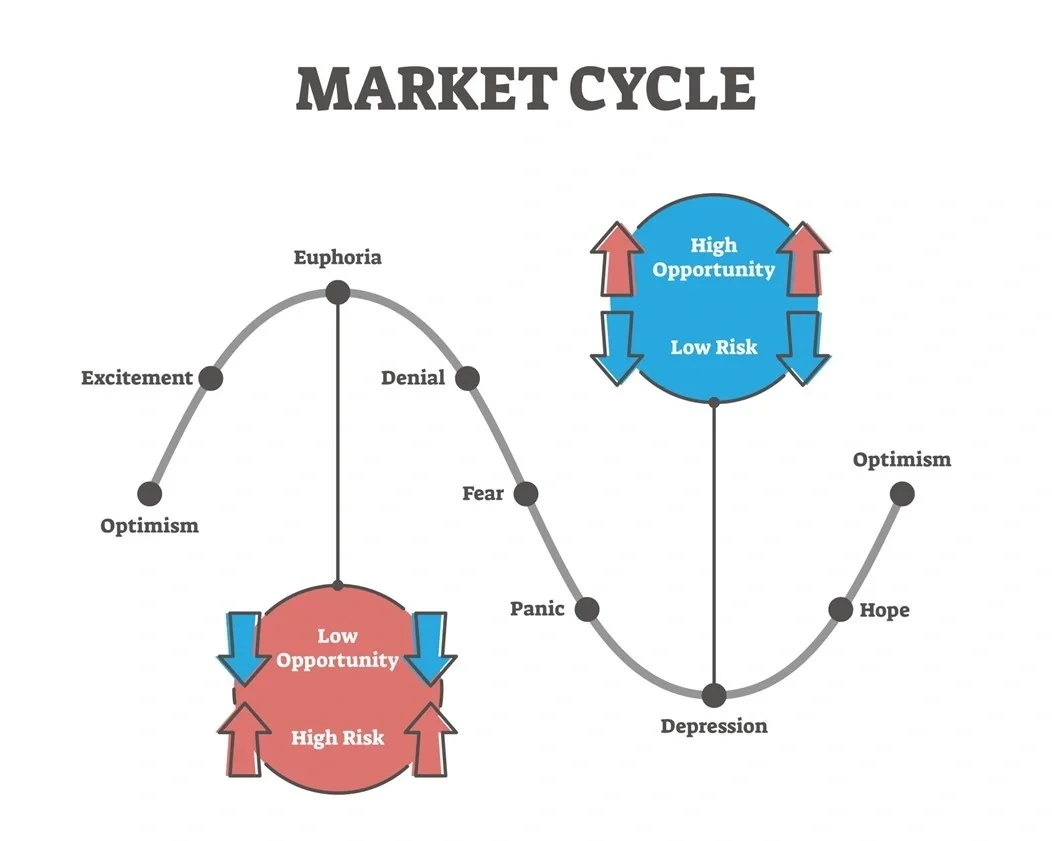
The Psychology of Boom & Crash Trading
The high volatility of these instruments underscores the importance of psychology.
Common Mistakes to Avoid
Even with a strong trading strategy, novice traders often fail due to psychological and procedural errors:
- Overleveraging: Using excessive lot sizes to chase quick returns, dramatically increasing the exposure to risk from sudden spikes.
- Ignoring the Trend: Attempting to catch every boom or crash against a strong overall market trends (e.g., trying to buy a boom spike during a sustained bearish trend).
- Emotional Trading: Making decisions based on fear after a loss (leading to missed trades) or greed after a win (leading to increased lot size).
- No Trading Plan: Entering a position without predefined exit points (Stop-Loss Orders and Take Profit).
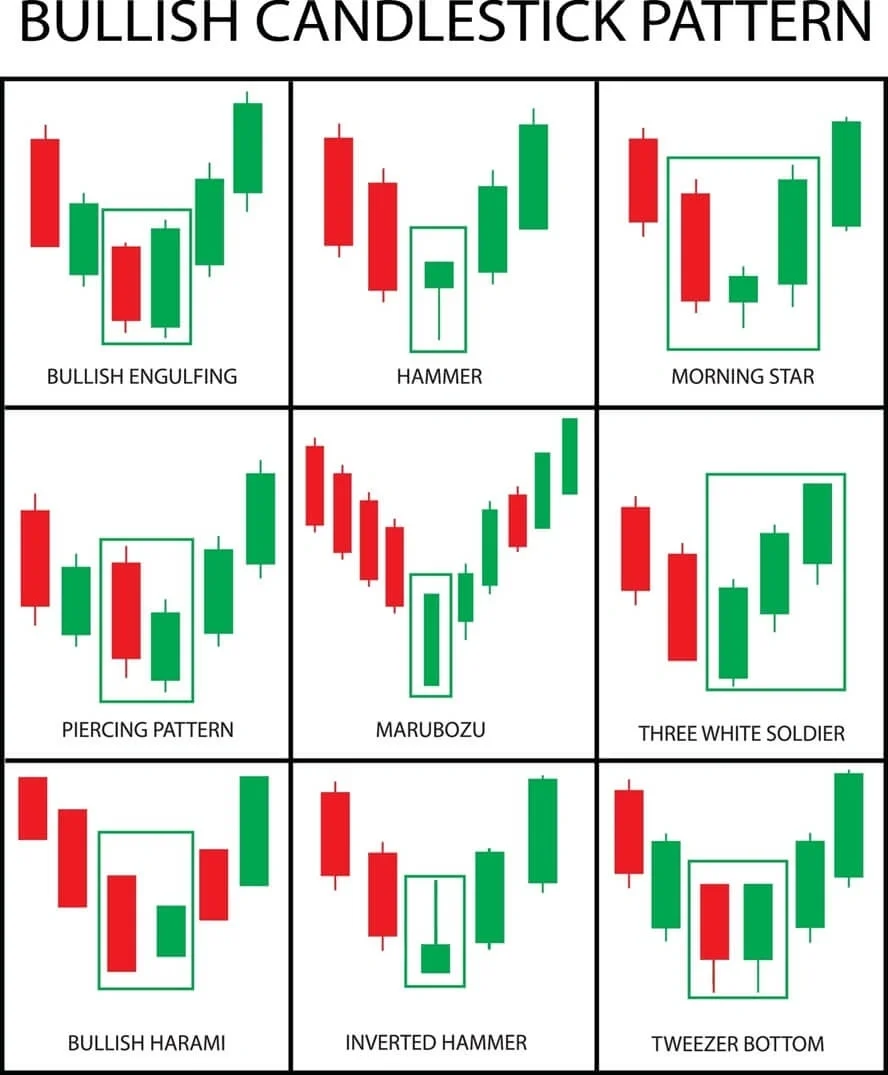
Entry Confirmation: The Role of Candlesticks
While technical indicators provide the primary signal (e.g., RSI Divergence), price action – specifically candlestick patterns – offers the final, crucial confirmation for entry.
| Pattern | Signal | Action |
|---|---|---|
| Hammer/Inverted Hammer | Appears after a sharp drop, signalling immediate rejection of lower prices. | Enter only after the Hammer candle closes, confirming the initial buying pressure. |
| Bullish Engulfing | A large bullish candle completely covers the body of the previous bearish candle. | This is a high-probability reversal signal. Enter the subsequent candle’s opening. |
A disciplined trader will use the RSI Divergence to create the alert, but only pull the trigger after a powerful bullish reversal candle closes on the M15 timeframe.
The Volatility Challenge: Managing Slippage
Slippage, the difference between the expected execution price and the actual execution price, is a major factor in crash trading due to the sudden price movements.
- Negative Slippage: Occurs when your Stop-Loss Orders are executed at a worse price than requested. This is the biggest risk when the spike/crash moves against your position.
- Mitigation Strategy:
- Avoid Over-Scalping: While tempting, trying to exit positions on very low timeframes increases the chance of being hit by a spike before your order is processed.
- Increase Stop-Loss Distance: Placing a very tight Stop-Loss Order is often ineffective, as the system’s volatility can blow past it instantly. A slightly wider stop, calculated using the formula above, can be safer.
Validation Protocol: Backtesting the Synthetic Market
The synthetic nature of Boom and Crash indices requires a specific validation process for your strategy:
- Systematic Backtesting (Manual Review): Manually scroll through the chart history on your chosen timeframe (e.g., M15). Record every single instance where your exact RSI Divergence setup occurred over 6 months. Document the outcome (Win/Loss/Breakeven) for your fixed 1:2 R:R ratio.
- Live Demo Testing: Before committing capital, test the strategy in a simulated live environment for at least one whole month. This tests your discipline and composure under real-time conditions without risking money.
Essential Tools and Resources
- Access to the right technical analysis tools is crucial.
- Stop-Loss Orders are non-negotiable to limit risk.
- Position sizing calculators ensure you only risk 1-3% of your capital per trade.
Pros and Cons of the Strategy
| Pros | Cons |
|---|---|
| High Profit Potential (Significant gain) | High Risk (risky) of losses due to slippage. |
| Fast Feedback Loop (trades resolve quickly). | Requires experience and strict discipline. |
| Pure Technicals (no fundamental news to track). | Volatility can cause high emotional stress. |
Conclusion
Boom-and-crash trading offers a thrilling experience. While the potential rewards are significant, the risk is equally high. Success requires skill, discipline, and knowledge of risk management. By applying a sound trading strategy, consistently protecting your capital, and rigorously validating your methods through backtesting, traders can navigate this market and realise substantial profits on their investments.
Disclaimer: The content of this article is intended for informational purposes only and should not be considered professional advice.