Stochastics: Momentum Indicator
Written by Aaron Akwu, Head of Education Hantec Markets
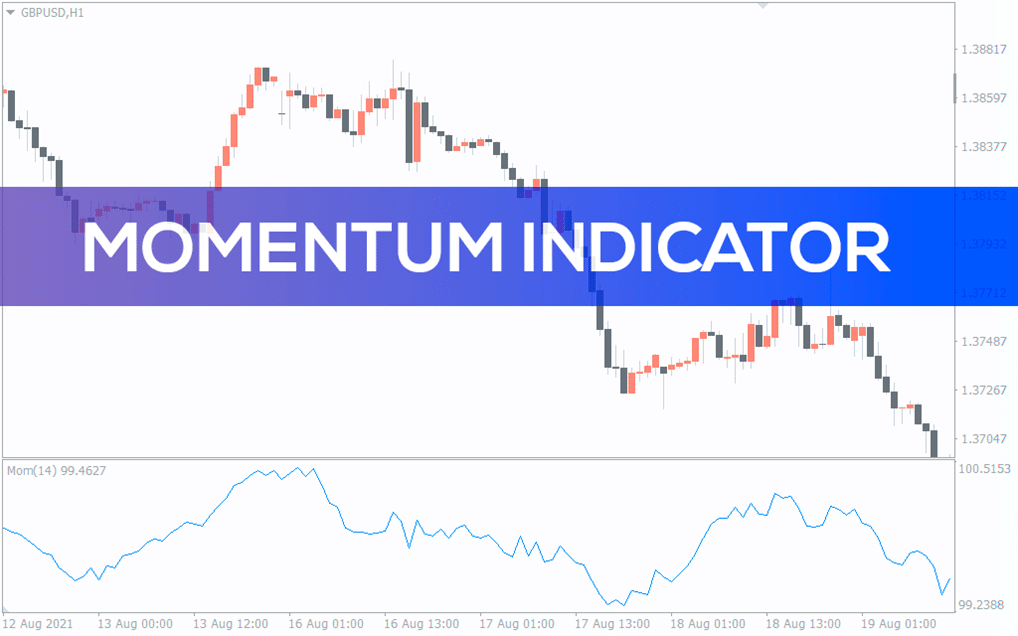
What are Momentum Indicators?
Momentum indicators are a set of technical indicators used in technical analysis to measure the strength of a trend and the likelihood of its continuation. They help traders and investors identify overbought or oversold conditions in the market and provide signals for buying or selling securities.
One of the most popular momentum indicators is the Relative Strength Index (RSI). It compares the magnitude of recent gains to recent losses to determine whether a stock is overbought or oversold. If the RSI is above 70, the security is considered overbought, and if it is below 30, it is oversold. Traders often use the RSI to confirm a trend and identify potential reversal points.
Another momentum indicator is the Moving Average Convergence Divergence (MACD). It is a trend-following indicator that uses two moving averages, a fast one and a slow one, to generate buy and sell signals. When the fast-moving average crosses above the slow-moving average, it signals a buy, and when it crosses below, it signals a sell. Traders often use the MACD to confirm trends and identify potential reversals.
Stochastics is another momentum indicator that measures the momentum of a stock price relative to its high and low range over a specified period. It generates buy and sell signals based on overbought or oversold conditions, similar to the RSI.
Momentum indicators are useful in identifying potential trend reversals and confirming existing trends. However, like all technical indicators, they have their limitations and should be used in conjunction with other tools and analysis techniques to make informed trading decisions.
What is Stochastics?
When it comes to forex trading, one term you may come across is “stochastic.” Stochastic refers to a type of technical analysis indicator used to measure momentum and identify potential buy and sell signals in the market.
The stochastic oscillator works by comparing the current closing price of a currency pair to its price range over a specific period of time. The idea behind this is that the closing price tends to be closer to the high or low of the range during times of bullish or bearish price movements, respectively.
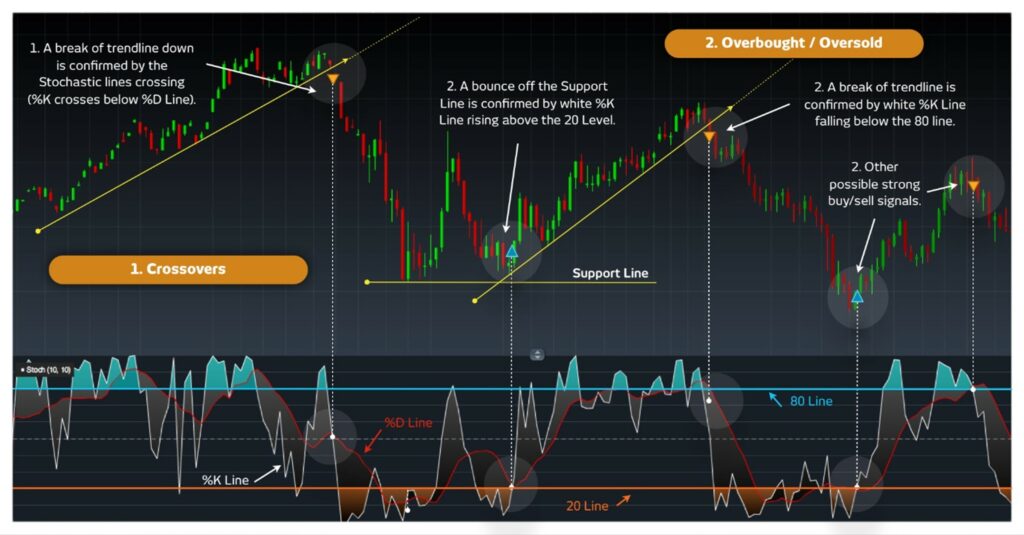
The stochastic oscillator is displayed as two lines on a chart, with one line representing the actual oscillator value and the other line representing a moving average of the oscillator value. These lines oscillate between 0 and 100, with values above 80 indicating an overbought condition and values below 20 indicating an oversold condition.
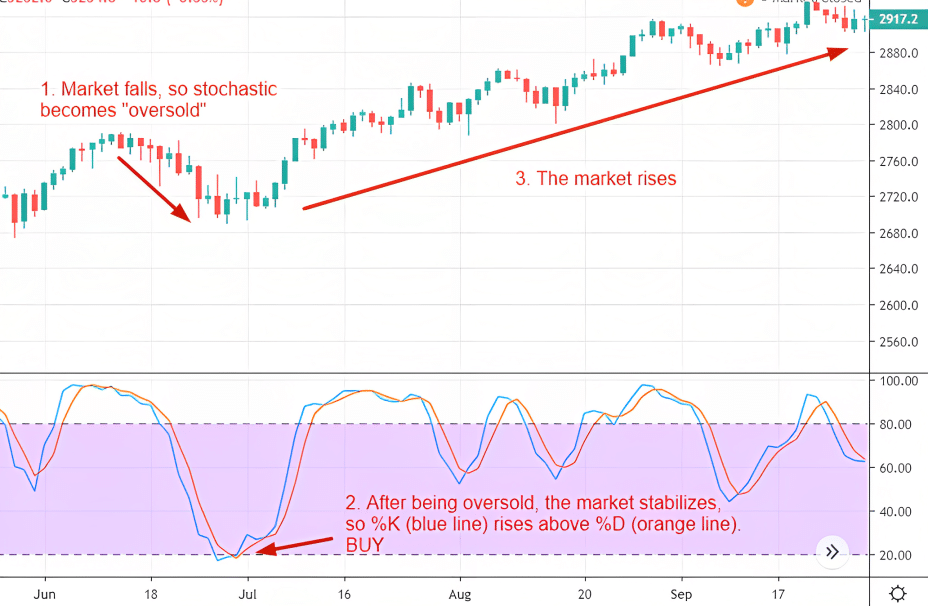
Traders can use the stochastic oscillator to identify potential buy and sell signals. When the oscillator crosses above the 20 level, it may indicate a potential buy signal, while a cross below the 80 level may indicate a potential sell signal. However, it is important to note that the stochastic oscillator should be used in conjunction with other technical analysis tools to confirm these signals.
In addition to buy and sell signals, the stochastic oscillator can also provide insight into potential price movements. For example, if the oscillator value is trending higher while the price of the currency pair is trending lower, it may indicate that a price reversal is imminent.
Overall, the stochastic oscillator is a useful tool for forex traders looking to identify potential buy and sell signals and gain insight into market momentum and price movements. By analyzing the closing price of currency pairs over a specific period of time, traders can use the stochastic oscillator to make informed trading decisions.
The role of stochastic in identifying overbought and oversold conditions
When analysing stock prices using the stochastic oscillator, traders look for two key levels: overbought and oversold. An overbought condition occurs when the latest closing price is near the highest price of the range, indicating that the security may be due for a price correction. On the other hand, an oversold condition occurs when the latest closing price is near the lowest price of the range, indicating that the security may be undervalued and could potentially rebound.
Traders often use the stochastic oscillator in conjunction with other technical indicators, such as the directional movement system (DMS) and the average directional index (ADX). The DMS and ADX are trend indicators that help traders determine the strength and direction of a trend. The stochastic oscillator can help traders confirm a trend identified by the DMS and ADX or identify potential reversals in the trend.
The stochastic oscillator is calculated by comparing the latest closing price of a security to its price range over a certain period. The formula for the stochastic oscillator involves calculating the %K and %D values, which are then plotted on a graph. Traders often use a 14-period time frame for the stochastic oscillator, but this can be adjusted to suit individual trading strategies.
Stochastic as a signal for trend reversal or continuation
When using the stochastic indicator, traders typically focus on the relationship between the current price of an asset and its recent price history. They look at both the momentum and the minus directional indicator to gain insight into the underlying strength of the trend.
If the stochastic reading indicates that the current price is near the top of its recent range and the momentum is decreasing, this may suggest that the trend is losing momentum and could potentially reverse. On the other hand, if the stochastic reading indicates that the current price is near the bottom of its recent range and the momentum is increasing, this may suggest that the trend is gaining strength and could continue.
Common mistakes to avoid when using stochastic in trading
When it comes to trading, stochastic analysis is a popular tool used by traders to identify potential price reversals in the market. However, like any other trading tool, there are common mistakes that traders make when using stochastic analysis. Here are some mistakes to avoid:
- Over-reliance on stochastic signals: One of the biggest mistakes traders make is relying solely on stochastic signals without taking into account other market indicators. Stochastic analysis is just one tool in your trading arsenal, and it should be used in conjunction with other tools like trend lines, support and resistance levels, and other technical indicators.
- Ignoring the bigger picture: Traders often make the mistake of focusing too much on short-term stochastic signals and ignoring the bigger picture. It’s important to step back and look at the overall market trend, as well as any fundamental factors that may be driving the market.
- Using default settings: The default settings on your stochastic indicator may not be suitable for your trading strategy or the market conditions you’re trading in. Experiment with different settings to find the ones that work best for you.
- Not considering market volatility: Stochastic analysis can be less reliable in highly volatile markets, as the price can quickly move in either direction. Take market volatility into account when using stochastic analysis.
- Taking stochastic signals too literally: Stochastic signals are just that – signals. They should be used as a guide rather than a hard-and-fast rule. Always use your own judgment and consider other market factors before making a trade based solely on a stochastic signal.
- Not using stop-loss orders: Finally, it’s essential to use stop-loss orders to limit your losses in case a trade doesn’t go as planned. Many traders make the mistake of not using stop-loss orders and end up losing more money than they can afford.