
Technical analysis and its theoretical framework teach us that history repeats itself. This is why we interpret repetitive events as cycles or patterns in technical analysis.
Does trader psychology play a role in these patterns? Hope and anxiety are common emotions felt by traders, and this often translates into a ‘herd’ that reacts to day-to-day macroeconomic events.
In fact, in the early 1920s, accountant and author Ralph Nelson Elliott identified that the mood or mass psychology of traders affected the market prices of different securities.
His theory, the Elliott Wave Theory, stated that the ups and downs in trader psychology (or “waves”) were directly related to upward and downward price swings. In other words, changes in the mass psychology of traders have an impact on market prices in patterns that can be identified.
Remember that this theory is not a foolproof or proven method. The patterns are open to interpretation, and different analysts can arrive at different conclusions based on the same data. Traders may prefer other methods for a more data-backed approach to market analysis.
However, once traders have done their analysis, some may choose to use this method to confirm the signals they arrive at.
Table of Contents:
Impulsive and Corrective Waves
According to the Elliott Wave Theory, market prices move in five waves in the same direction as the main trend, accompanied by three waves against the main trend. The initial five waves form the impulsive dominant trend, whereas the following three waves form the net corrective countertrend.
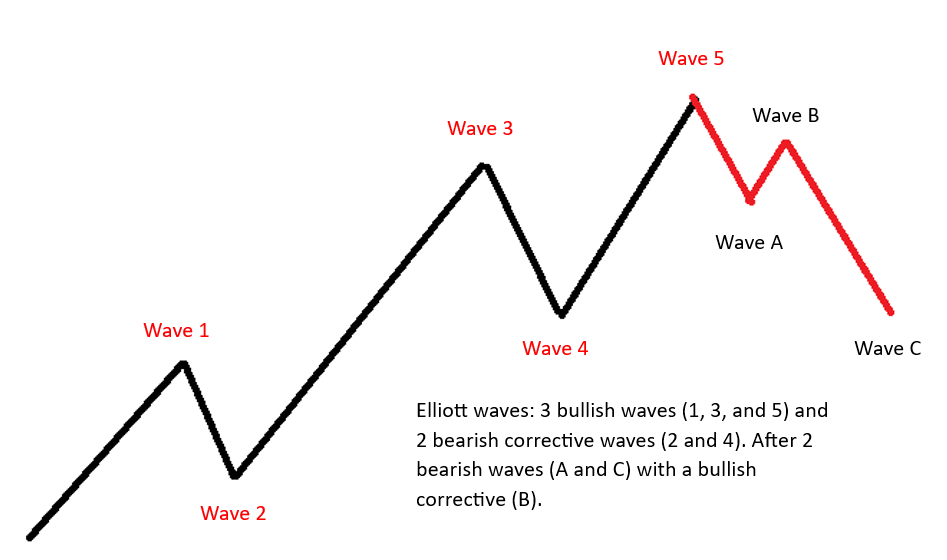
Here, 3 bullish waves (Waves 1, 3, and 5) and 2 bearish waves (Waves 2, 4) form the impulsive net upward direction of the trend.
This is followed by 2 bearish waves (Waves A and C) with a bullish wave (Wave B) in between them, forming the downward correction.
What are the Parameters for Calculating Waves?
The Fibonacci sequence is a series of numbers where each number is the sum of the previous two numbers, starting with 0 and 1. It forms the basis of the Fibonacci retracement, a technique that can help to measure the potential length of waves within an Elliott Wave structure.
Check out our complete guide to Fibonacci retracements to learn more about how to use them when analysing charts.
Example 1: Understanding the impulsive tranche
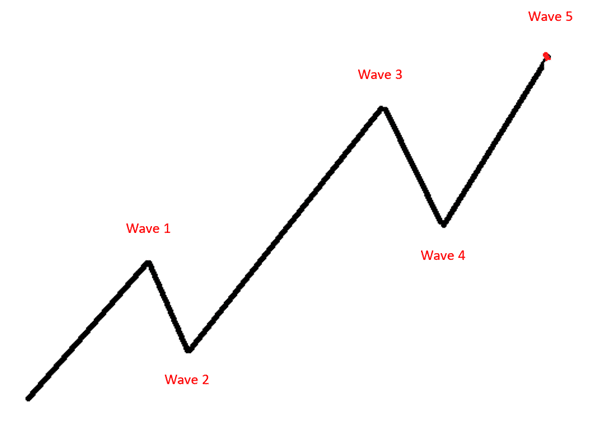
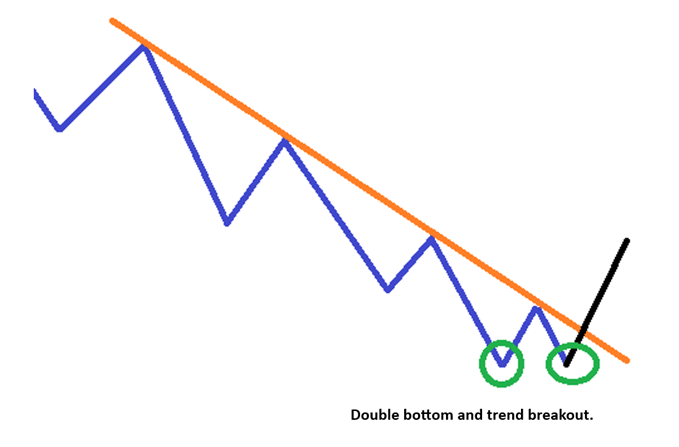
Wave 1: This is a bullish leg. The help of chart analysis is imperative, as breakouts are the first signs of an Elliott wave forming, with a second indication being a trend reversal following a breakout. When this happens, we can define a severe correction of more than 50% (based on Fibonacci retracement).
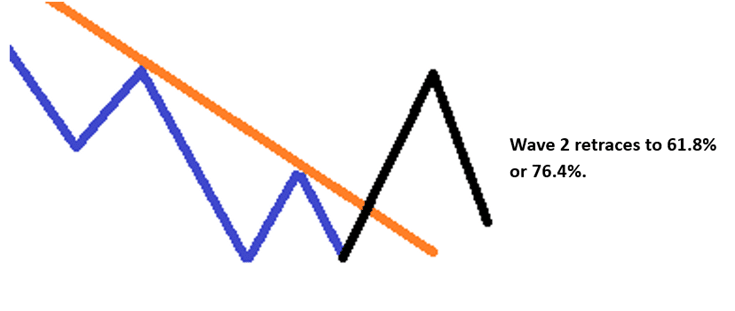
Wave 2: This is a correction to Wave 1. We can expect a pullback of no less than 61.8% and no more than 76.4% (according to the Fibonacci retracement).
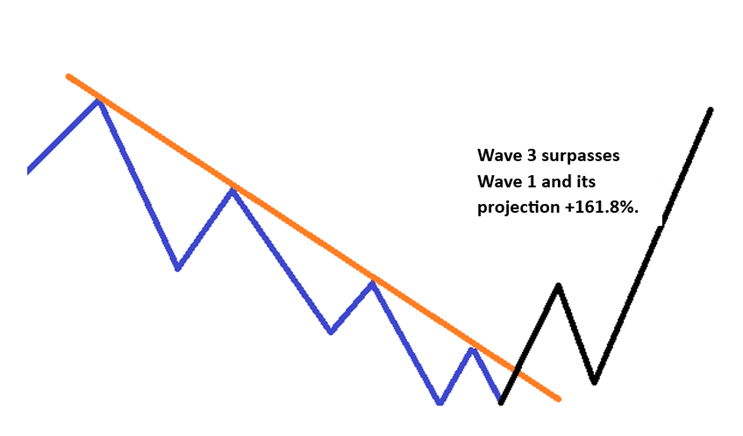
Wave 3: As the next waveforms, if it were to surpass the length of Wave 1, this can be taken as another confirmation of the potential formation of an Elliott Wave. This new Wave 3 has a minimum projection of 161.8% (calculated according to the Fibonacci extension) of Wave 2. As a general rule, Wave 3 is usually the strongest of the impulsive waves, never being less than the other two waves indicated.
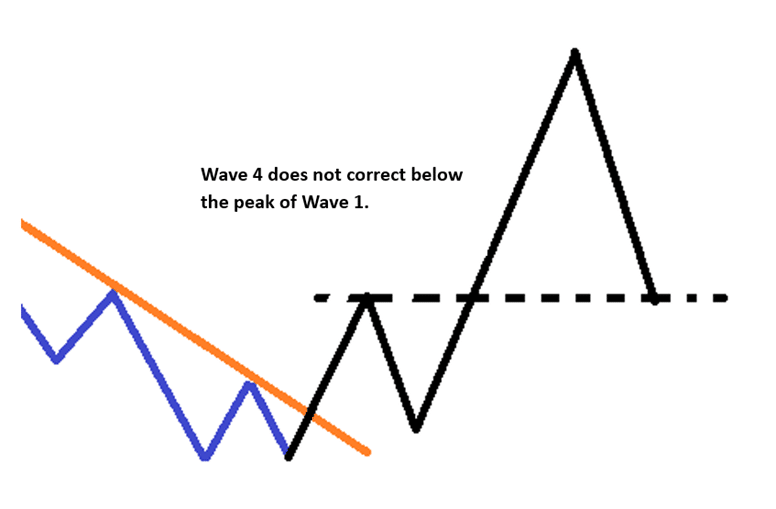
Wave 4: This wave is a correction to Wave 3. A crucial rule of thumb is to consider a pullback that does not exceed the high of Wave 1. It usually tends to be the most irregular of the waves in terms of behaviour due to the retracement it can signal with respect to Wave 3, achieving corrections of 38% (according to Fibonacci retracement) or also validated around 23%.
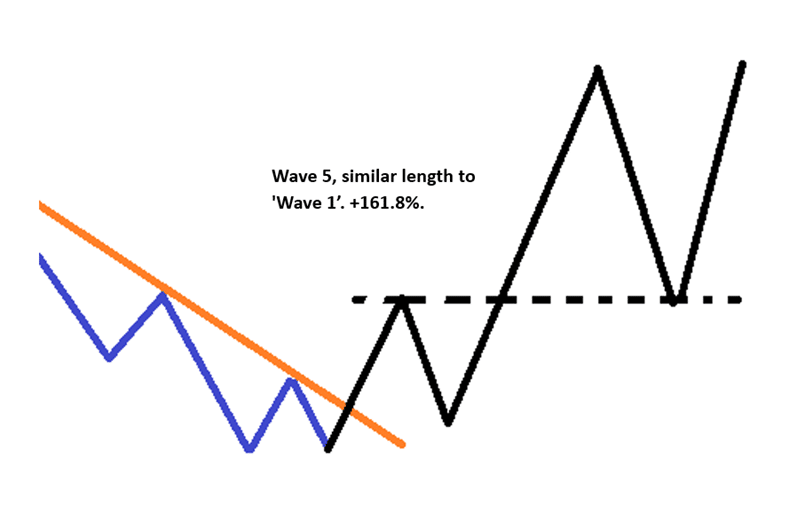
Wave 5: Wave 5 overcomes Wave 3. The key is to have a projection of 161.8% of Wave 4 and of similar length to Wave 1. One of its main characteristics is that it comprises a significant increase in traded volume, which is usually not accompanied by a significant increase in price.
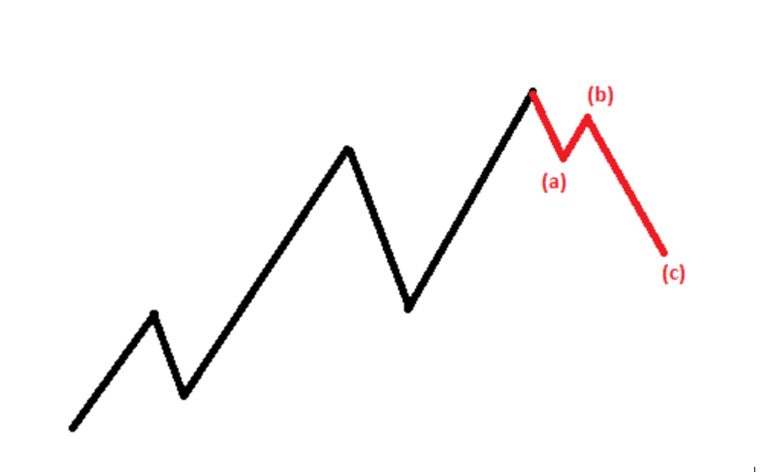
Example 2: Understanding the corrective tranche
Without a doubt, this is where many traders lose the battle, where three waves occur in a zig-zag corrective countertrend in the opposite direction to the previous five.
Wave A: This is the first wave that starts from the end of Wave 5. It manages to develop in the same direction as Wave 4 but does not usually exceed the highs of Wave 3.
Wave B: This is the correction of Wave A, normally considered up to 50-62% and should never exceed 75%.
Wave C: It has the same length as Wave A. It achieves 150 to 161.8% of Wave B, or 261.8% of Wave B in extreme cases.
What Indicators Can I Use with Elliott Wave Theory?
Elliott waves can be a very useful tool for many traders. However, it is absolutely important to consider that it is not a proven theory. Rather, they can be used along with other technical indicators to identify entry and exit points. In this case, these waves can be considered more as confirmational patterns than patterns used to identify a trend.
The Moving Average Convergence Divergence (MACD) is one of the most popular indicators to pair with Elliott Wave analysis and is especially helpful to beginner traders. It allows us to anticipate changes in direction and supports the reading of the waves to confirm the start of a bullish or bearish pattern.
The Relative Strength Index (RSI) is another indicator that is helpful alongside the Elliott Wave Theory as it can be used to measure the strength of the trend and to identify potential reversals.
Ultimately, keep in mind that every analytical approach has its own applications, and none provide any kind of guarantee. So, make trading decisions based on robust risk management principles, and use tools such as demo accounts to test your approach.
Disclaimer: The content of this article is intended for informational purposes only and should not be considered professional advice.