What is Relative Strength Index (RSI) Indicator?
Get to grips with the relative strength index (RSI), a vital momentum indicator used in technical analysis to assess the market momentum of an asset and understand if it has been overbought or oversold.
Written by Aaron Akwu, Head of Education Hantec Markets
The relative strength index (RSI) is a technical trading system used by traders and investors to analyse price movements of a stock or asset. This indicator measures the strength of an asset’s price movement by comparing the average gains to the average losses over a certain period of time, typically 14 days.
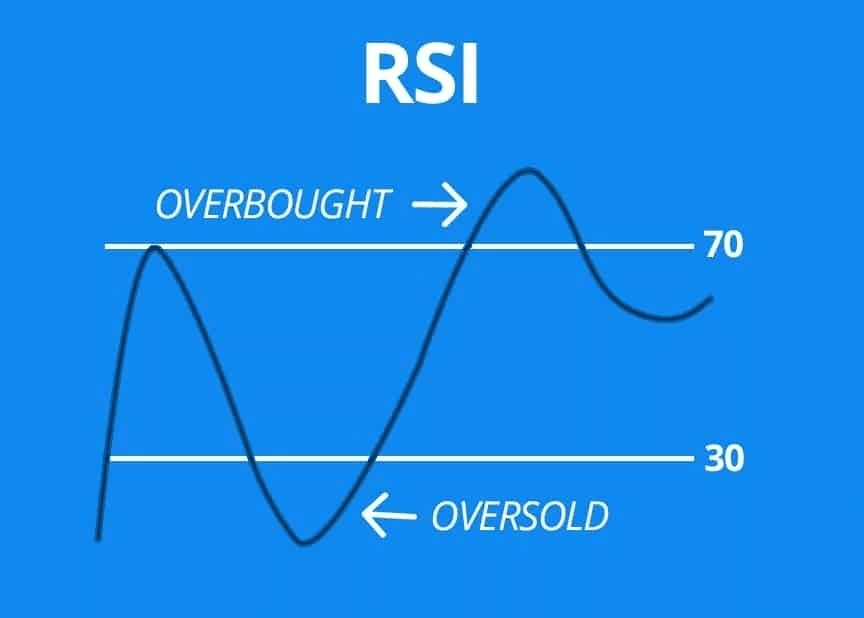
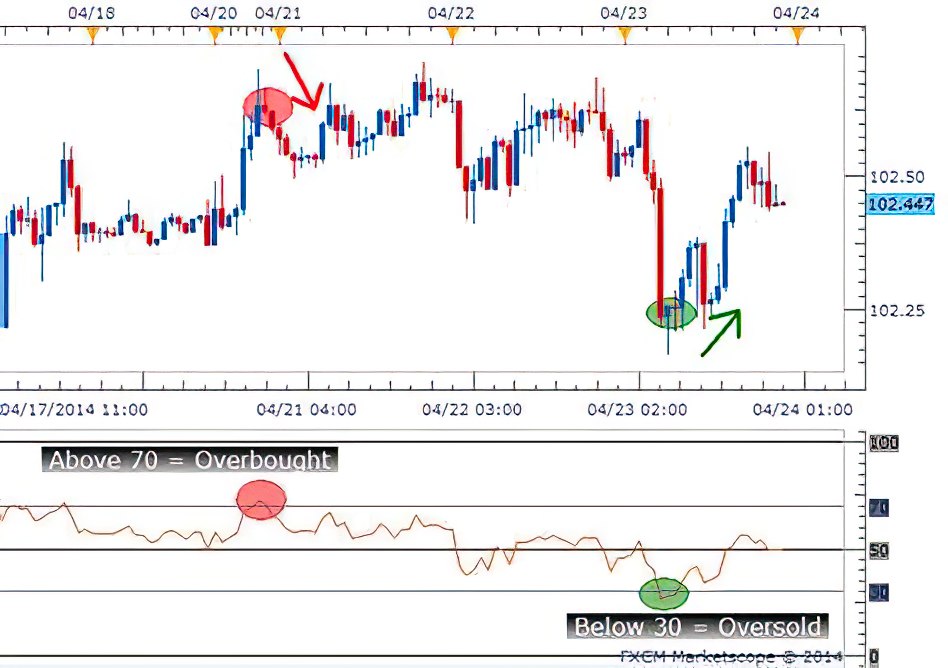
The RSI is plotted on a price chart and ranges from 0 to 100. When the RSI is above 70, the asset is considered overbought, and when it’s below 30, it’s considered oversold. Traders use these levels as potential signals to buy or sell the asset.
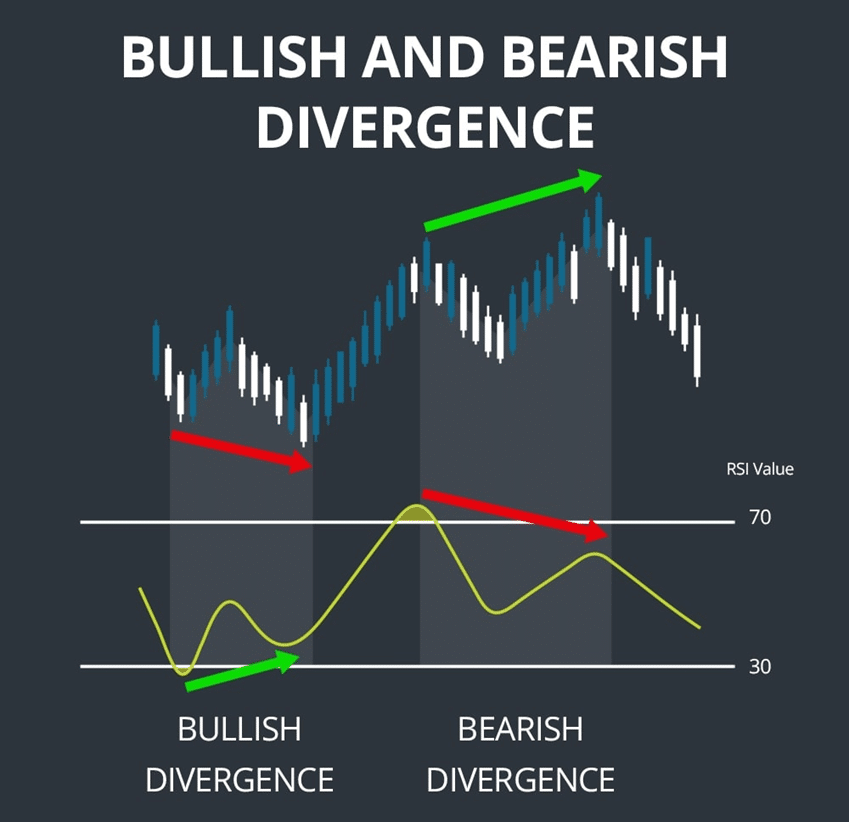
One important aspect of the RSI is when a bullish divergence occurs. This is when the price chart shows a lower low, but the RSI shows a higher low. This can indicate that the price may reverse and move upwards, providing a buying opportunity.
Overall, the RSI is a useful tool for traders and investors to identify potential trends and market movements. It can provide valuable insights into an asset’s price movements, helping to inform decision-making when buying or selling.
How Relative Strength Index Indicator Works
The Relative Strength Index (RSI) is a popular technical analysis tool used to measure the strength of a security’s price movement. It is a momentum oscillator that compares the magnitude of a security’s recent gains to the magnitude of its recent losses, indicating whether the asset is overbought or oversold.
The RSI values range from 0 to 100, where an RSI value of 70 or higher indicates an overbought condition and a value of 30 or lower suggests an oversold condition. The RSI is calculated using a formula that takes into account the average gains and losses of a stock over a certain period of time.
Traders use the RSI to identify potential trend reversals by looking for bearish and bullish divergences. A bearish divergence occurs when the RSI is making lower highs while the price of the security is making higher highs. This suggests that the price movement is losing strength and could be due for a reversal. Conversely, a bullish divergence occurs when the RSI is making higher lows while the price of the security is making lower lows, indicating that the price may soon reverse to the upside.
Moreover, the RSI can also help traders determine whether an asset is overbought or oversold, which can be useful for identifying potential entry or exit points. For example, an RSI value above 70 suggests that the security is overbought and could be due for a price correction. On the other hand, an RSI value below 30 suggests that the asset is oversold and may be due for a rebound.
Overall, the Relative Strength Index is a versatile tool that can help traders identify potential trend reversals, as well as overbought and oversold conditions. By keeping an eye out for bearish and bullish divergences and monitoring RSI values, traders can make more informed trading decisions and potentially increase their profits.bullish divergences
The RSI calculation
To calculate RSI, you need to determine the average gain and average loss of a security over a given time period. The most commonly used time period for RSI is 14 days, but this can be adjusted based on a trader’s preferences.
To calculate the average gain and average loss, you need to determine the price change of the security over the specified time period. If the price of the security increases, this is considered a gain, and if it decreases, it is considered a loss. Once you have determined the gains and losses, you can calculate the average gain and average loss using the following formula:
Average Gain = (Sum of Gains over the specified time period) / (Number of periods in the specified time period)
Average Loss = (Sum of Losses over the specified time period) / (Number of periods in the specified time period)
Once you have calculated the average gain and average loss, you can use these values to calculate the RSI using the following formula:
RSI = 100 – (100 / (1 + (Average Gain / Average Loss)))
The RSI measures the strength of a security’s price action on a scale of 0-100, with readings above 70 indicating overbought conditions, and readings below 30 indicating oversold conditions. Traders use overbought and oversold levels to determine when to enter or exit a trade.
For example, let’s say you want to calculate the RSI of a stock over the past 14 days. The stock has had gains of $10, $8, $6, $12, $5, $7, $11, $9, $4, $2, $1, $3, $5, and $2 over the past 14 days, and losses of $0, $1, $2, $0, $3, $2, $1, $3, $5, $6, $8, $7, $4, and $3 over the same period.
To calculate the average gain, you would add up the gains and divide by 14:
Average Gain = (10 + 8 + 6 + 12 + 5 + 7 + 11 + 9 + 4 + 2 + 1 + 3 + 5 + 2) / 14 = 5.5
To calculate the average loss, you would add up the losses and divide by 14:
Average Loss = (0 + 1 + 2 + 0 + 3 + 2 + 1 + 3 + 5 + 6 + 8 + 7 + 4 + 3) / 14 = 3.14
Using these values, you can calculate the RSI:
RSI = 100 – (100 / (1 + (5.5 / 3.14))) = 63.45
With an RSI of 63.45, the stock is not currently in overbought or oversold conditions, but traders may use this information to make decisions about entering or exiting a trade.
Overbought and oversold
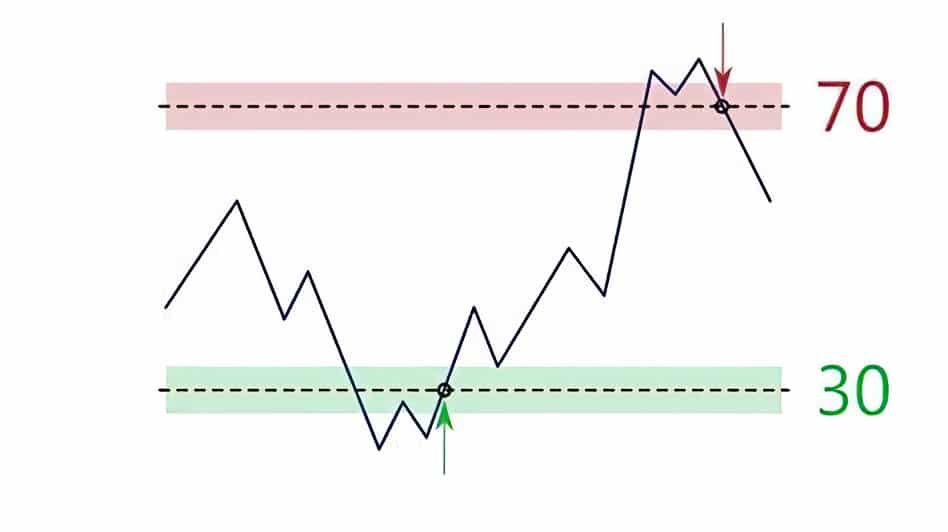
When it comes to technical analysis in trading, the Relative Strength Index (RSI) is a popular indicator used to measure the momentum of a security’s price movements. The RSI oscillates between 0 and 100, with readings above 70 considered overbought and readings below 30 considered oversold.
An overbought condition in the RSI suggests that security has experienced a sharp price increase and may be due for a pullback or correction. In contrast, an oversold or undervalued condition indicates that a security’s price has fallen significantly and may be due for a rebound. It’s important to note, however, that overbought and oversold readings on the RSI do not necessarily mean that a security’s price will immediately reverse its course.
Traders can use the RSI to identify potential failure swings, which occur when the RSI forms two peaks above the 70 level (indicating overbought conditions) with a trough between them that remains above the 30 level (indicating that the security is not yet oversold). A failure swing suggests that the bearish price momentum is increasing and that a reversal may be imminent.
Overall, the RSI is a useful tool for traders to help identify overbought and oversold securities and potential market trends. However, it’s essential to remember that no indicator is perfect, and traders should always use additional analysis and risk management techniques to make informed trading decisions.
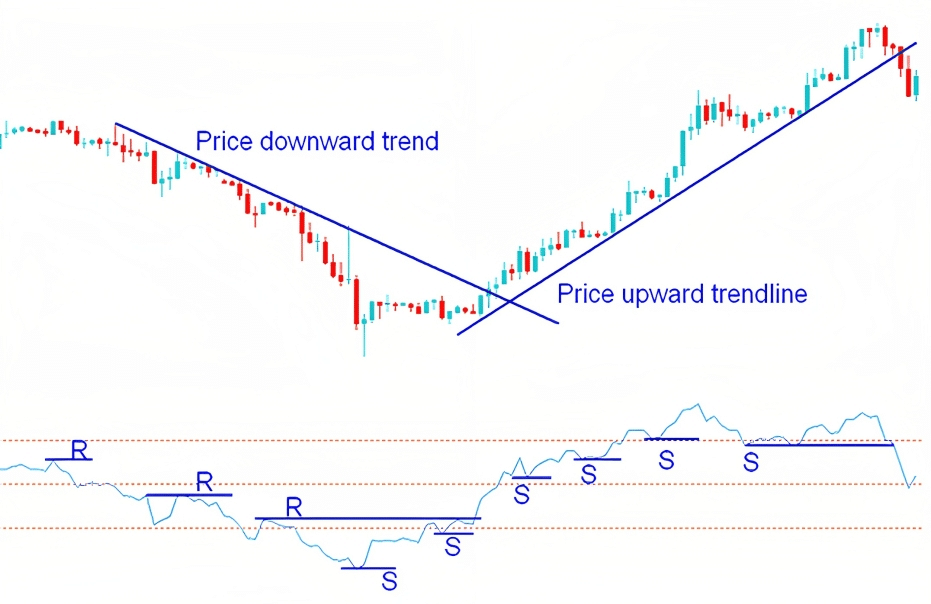
RSI with Trends
One way to use RSI is to look for RSI divergences. This occurs when the price of an asset and the RSI indicator are moving in opposite directions. For example, if the price of an asset is making higher highs, but the RSI is making lower highs, this is a bearish divergence, which may signal a potential trend reversal. Conversely, if the price is making lower lows, but the RSI is making higher lows, this is a bullish divergence, which may indicate a potential trend reversal to the upside.
Another way to use RSI is in conjunction with technical trading systems. Traders may use RSI in combination with other technical indicators, such as moving averages or trend lines, to confirm or validate their trading signals. For example, if the RSI indicates that an asset is oversold and the price is bouncing off a key support level, this may signal a potential buying opportunity for traders who follow a trend-following trading system.
RSI Divergence Indicator
The RSI divergence indicator works by comparing the current price of a security with the RSI readings. If the price is making higher highs, but the RSI is making lower highs, this is called a bearish divergence. On the other hand, if the price is making lower lows, but the RSI is making higher lows, this is called a bullish divergence.
These divergences can indicate that the momentum of the price is starting to weaken, and a reversal may be imminent. The RSI divergence indicator is particularly useful for traders who use technical analysis to make their trading decisions, as it provides a clear signal that the trend may be changing direction.
It’s important to note that the RSI divergence indicator should not be used in isolation, as other technical indicators and analysis should be used to confirm any potential trend reversals. However, by keeping an eye on RSI readings and identifying any divergences, traders can gain valuable insight into the potential direction of the market.
Failure swings
A failure swing in RSI occurs when the indicator fails to make a higher high or lower low despite a corresponding higher high or lower low in the price of the asset being analyzed. This divergence can indicate that the momentum of the trend is weakening, and a reversal could be imminent.
There are two types of failure swings in RSI: bullish and bearish. Here’s how they work:
Bullish Failure Swing:
A bullish failure swing occurs when the RSI makes a lower high, but the price of the asset makes a higher high. This indicates that the upward momentum of the trend is weakening, and the price may be due for a reversal to the downside. Traders may look for confirmation of this signal with additional technical analysis or by monitoring price action.
Bearish Failure Swing:
A bearish failure swing occurs when the RSI makes a higher low, but the price of the asset makes a lower low. This indicates that the downward momentum of the trend is weakening, and the price may be due for a reversal to the upside. Traders may look for confirmation of this signal with additional technical analysis or by monitoring price.

Interpretation of RSI and RSI Ranges
Here’s a breakdown of how to interpret RSI and RSI ranges in currency trading.
When the RSI is above 70, it indicates that the currency is overbought, and a bearish reversal may occur. In other words, the market is likely to correct itself, and prices may begin to fall. For example, let’s say the USD/JPY pair has an RSI of 80, indicating that the market is overbought. Traders may take this as a signal to sell the USD/JPY pair, expecting a potential decline in price.
On the other hand, when the RSI is below 30, it indicates that the currency is oversold, and a bullish reversal may occur. In this case, the market is likely to correct itself, and prices may begin to rise. For instance, let’s say the EUR/USD pair has an RSI of 20, indicating that the market is oversold. Traders may take this as a signal to buy the EUR/USD pair, anticipating a potential increase in price.
It’s worth noting that the RSI is not always accurate, and it can sometimes give false signals. Therefore, it’s important to confirm the signal with other technical indicators or fundamental analysis before taking any trade positions. Traders may also adjust the RSI ranges to suit their trading style and risk tolerance.
Understanding how to interpret RSI and RSI ranges can be a valuable tool for currency traders. It can help traders identify potential trading opportunities and manage their risks effectively. However, it’s crucial to use RSI in combination with other technical and fundamental analysis tools to make informed trading decisions.
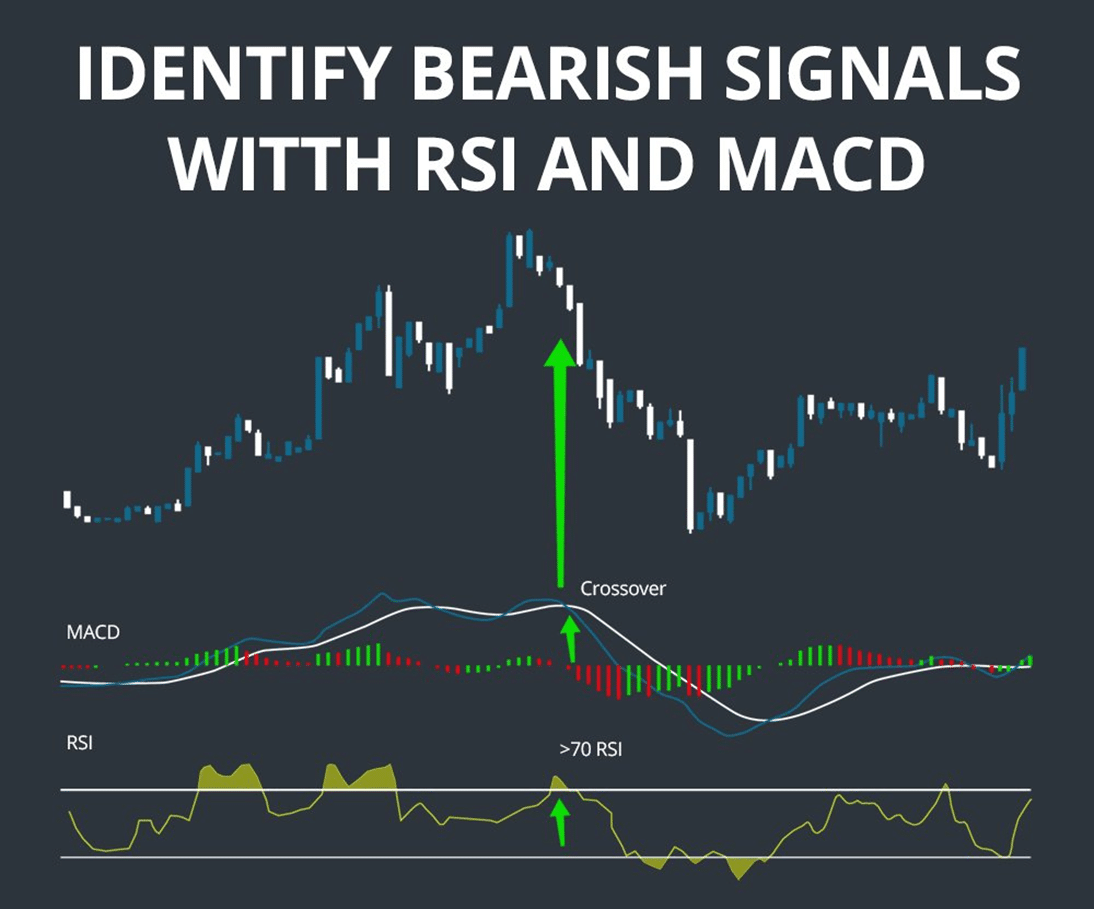
Differences between MACD and RSI Indicator
- The MACD indicator is derived from the difference between two exponential moving averages (EMA) of different time periods, while RSI is calculated by comparing the average gain and average loss of an asset over a certain period.
- MACD is more focused on trend identification, while RSI is more focused on momentum.
- MACD can help traders identify when a trend is strengthening or weakening, while RSI can help traders identify when momentum is shifting and when a potential reversal may occur.
- MACD is a lagging indicator based on past price data, while RSI is a leading indicator that can provide insight into potential market movements before they happen.
Both MACD and RSI can be useful tools for traders, but they have different strengths and weaknesses. Traders should consider using both indicators in conjunction with other analysis techniques to gain a more complete understanding of market trends and momentum.
Advantages of RSI Indicator
Here are some advantages of RSI:
- Provides clear signals: RSI is a momentum oscillator that ranges from 0 to 100, and provides clear signals of trend reversal or continuation. A reading above 70 indicates an overbought market, while a reading below 30 indicates an oversold market. Traders can use these signals to make informed trading decisions.
- Helps identify trend direction: RSI can help traders identify the direction of the trend. If the RSI is above 50, it indicates a bullish trend, while a reading below 50 indicates a bearish trend. By identifying the trend direction, traders can make better decisions on whether to buy or sell.
- Can be used in different markets: RSI can be used in different markets, including stocks, currencies, commodities, and indices. This makes it a versatile tool that can be applied to different trading strategies and styles.
- Can be used in combination with other indicators: RSI can be used in combination with other indicators to provide more accurate trading signals. For example, traders may use RSI along with moving averages or trend lines to confirm a trend reversal.
- Helps manage risk: RSI can help traders manage risk by providing them with information about potential price movements. By identifying oversold or overbought conditions, traders can set stop-loss orders and limit their losses in case the market moves against them.
Disadvantages of RSI Indicator
Here are some disadvantages of RSI:
- Over-reliance: RSI indicators may give false signals and can cause traders to over-rely on the indicator.
- Lagging indicator: RSI is a lagging indicator, which means that it may not give accurate signals when the market is rapidly changing.
- Not suitable for all markets: RSI is best suited for markets that are trending, and not well-suited for choppy, sideways markets.
- Can be subjective: Interpretation of RSI indicator signals can vary from trader to trader, leading to subjective analysis.
- Limited scope: RSI only measures the strength of a trend and does not provide any indication of the direction of the trend.
- Short-term focus: RSI indicators are designed to focus on short-term price movements and may not be effective for long-term analysis.
- Can lead to overtrading: Over-reliance on RSI indicators can lead to excessive trading, resulting in higher transaction costs and reduced profits.
- Ineffective during high volatility: RSI indicators may not work well during periods of high volatility when the market experiences sudden price swings.
- May not account for fundamental factors: RSI indicators only consider price movements and do not account for fundamental factors that may affect the market.
- Limited use in isolation: RSI indicators are best used in combination with other technical indicators to confirm signals, making it less effective when used in isolation.