The most traded commodity in 2026 is crude oil, followed by natural gas and gold. Crude oil remains first because Brent, WTI and crude oil options trade across some of the world’s deepest energy markets. Natural gas and gold continue to attract heavy hedging and speculative activity during periods of inflation, geopolitical risk and market volatility.
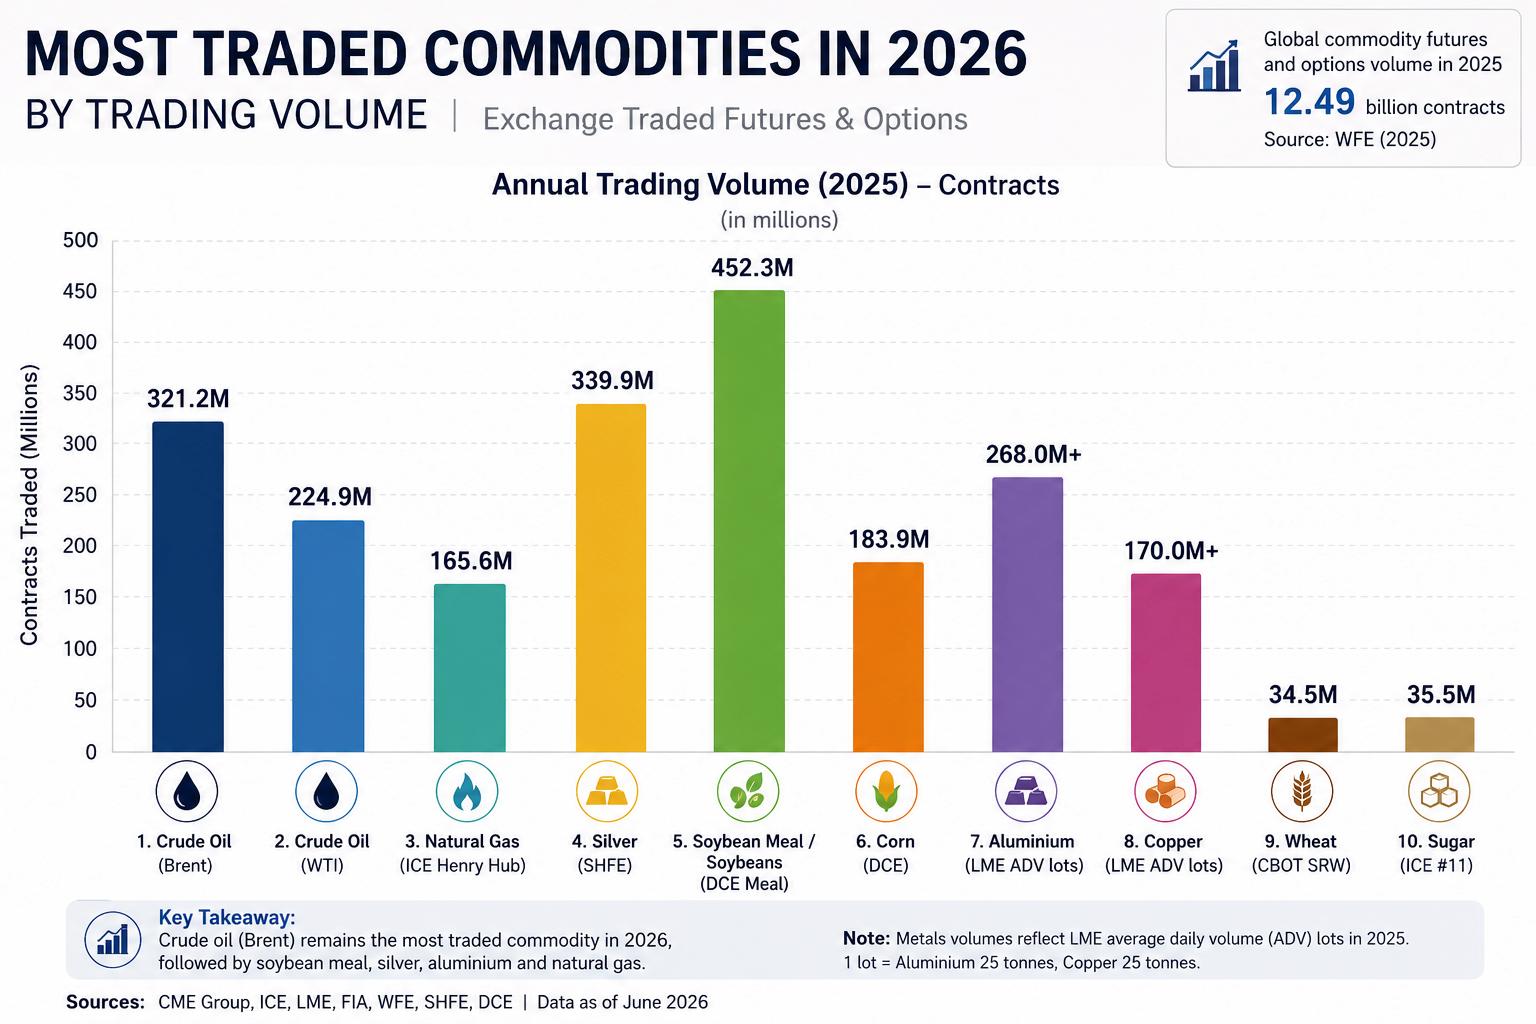
This ranking uses the latest available full-year exchange data from 2025, early 2026 market activity, and liquidity indicators from major commodity venues. The World Federation of Exchanges (WFE) reported that commodity futures and options volume reached 12.49 billion contracts in 2025, up 17.5% from 2024. CME Group, Intercontinental Exchange (ICE) and the London Metal Exchange (LME) all reported strong or record activity across energy, metals and agricultural markets.
Because exchanges use different contract sizes and reporting methods, the table below should be read as an indicative global liquidity ranking rather than a single universal league table.
Quick Summary
If you’re looking for a quick overview, the table below highlights the most traded commodities in 2026 and the main reasons they attract such high trading activity.
At a glance: Crude oil remains the most traded commodity in 2026, followed by natural gas and gold. Energy markets continue to dominate global commodity trading, while metals and agricultural commodities attract substantial trading volume because of their importance to the global economy, manufacturing and food supply chains.
Top 10 Most Traded Commodities in 2026
Source: CME Group, ICE, LME, FIA and WFE volume data, as of June 2026.
1. Crude Oil
Crude oil is the most traded commodity in 2026 because it sits at the centre of the global economy. It powers transport, supports petrochemical production, affects inflation and remains highly sensitive to geopolitics.
The two most watched crude benchmarks are WTI and Brent. WTI is the key US crude benchmark, while Brent is widely used in international oil pricing. Both attract heavy participation from producers, refiners, airlines, shipping companies, funds and short-term traders.
In 2025, ICE Brent futures traded 321.2 million contracts, while CME WTI futures traded 224.9 million contracts. WFE data also showed crude oil options as the largest commodity derivatives contract by volume in 2025.
Crude oil trading volume is driven by:
- OPEC+ production decisions
- Middle East and Russia-related supply risks
- US inventory data
- refinery demand
- global GDP expectations
- inflation and interest-rate expectations
Want to learn more? Read our complete How to Trade Oil guide to understand the factors that influence oil prices, common trading strategies and the different ways to trade crude oil.
2. Natural Gas
Natural gas is the second most traded commodity in 2026 because it is essential for electricity generation, heating, industrial production and LNG trade.
Natural gas is more seasonal than oil. Prices and trading volume often rise around winter heating demand, summer cooling demand, storage reports and LNG supply disruptions.
In 2025, major natural gas contracts remained highly active. ICE Henry Hub natural gas futures traded 165.6 million contracts, CME Henry Hub futures traded 137.1 million contracts, and ICE TTF gas futures traded 92.0 million contracts. ICE also reported record natural gas open interest in March 2026, including 46.6 million contracts across natural gas futures and options.
Natural gas trading volume is driven by:
- weather forecasts
- storage levels
- LNG exports and imports
- European energy security
- power-sector demand
- pipeline disruptions
3. Gold
Gold remains one of the most traded commodities in 2026 because it is both a precious metal and is widely regarded as a financial safe-haven asset.
Unlike oil or gas, gold is not consumed in large daily volumes. Its trading activity is driven more by macroeconomic risk, interest rates, central-bank buying, inflation expectations and US dollar movements.
Gold trading has also benefited from smaller contract sizes and increased retail participation. CME reported a record annual average daily volume (ADV) of 325,000 contracts for Micro Gold futures in 2025, while FIA data shows strong trading across SHFE Gold futures, MCX Gold Mini options, Micro Gold futures and COMEX Gold futures.
Gold trading volume is driven by:
- real interest rates
- inflation expectations
- central-bank reserve demand
- US dollar strength or weakness
- equity-market volatility
- geopolitical uncertainty
Want to learn more? Explore our Beginners Guide on How to Trade Gold for practical trading insights, or explore our Gold Price Prediction to 2030 for a long-term outlook on the gold market.
4. Silver
Silver is one of the fastest-growing traded commodities because it has a dual role. It behaves partly like a precious metal and partly like an industrial metal.
Silver is used in solar panels, electronics, batteries, medical equipment and electrical components. This gives it exposure to both safe-haven demand and industrial demand.
FIA data shows SHFE Silver futures traded 339.9 million contracts in 2025, making it one of the highest-volume precious-metal futures contracts globally. CME also reported a record December Micro Silver futures ADV of 200,000 contracts.
Silver trading volume is driven by:
- solar-energy demand
- gold-silver ratio trading
- inflation hedging
- retail trader participation
- electronics and EV demand
Want to learn more? Read our Silver trading guide to discover how industrial demand, precious-metal sentiment and economic data influence silver prices and trading opportunities.
5. Soybean Meal and Soybeans
Soybean meal and soybeans are among the most traded agricultural commodities because they are central to animal feed, food production and biofuel supply chains.
Soybean meal is especially active in Asia. DCE soybean meal futures traded 452.3 million contracts in 2025, making it one of the largest agricultural contracts globally. CME soybean futures also remained highly liquid, with annual ADV of 293,000 contracts in 2025.
Soybean trading volume is driven by:
- China import demand
- Brazil and US crop conditions
- livestock feed demand
- soybean crush margins
- biodiesel policy
- trade tariffs and export flows
6. Corn
Corn remains one of the most actively traded agricultural commodities because it is used in food, animal feed, ethanol and industrial products.
Corn futures often see high activity around planting, growing and harvest seasons. Trading volume can also spike around USDA reports, weather shifts and changes in biofuel policy.
In 2025, DCE corn futures traded 183.9 million contracts, while CME reported a record annual corn futures ADV of 437,000 contracts.
Corn trading volume is driven by:
- US Midwest weather
- South American crop conditions
- ethanol demand
- livestock feed demand
- government crop reports
- export sales
7. Aluminium
Aluminium is one of the most traded base metals because it is widely used across construction, transport, packaging and manufacturing.
It is lighter and cheaper than copper, which helps explain why aluminium often records higher contract volume. Producers, manufacturers and traders use aluminium markets to hedge exposure to industrial demand, energy prices and tariff risk.
LME Aluminium averaged more than 268,000 lots per day in 2025, while the LME’s total 2025 average daily volume reached 756,996 lots, up from 702,639 in 2024.
Aluminium trading volume is driven by:
- construction demand
- automotive lightweighting
- packaging demand
- electricity costs
- sanctions and tariffs
- China production trends
8. Copper
Copper is one of the most important industrial commodities because it is used in electrical wiring, power grids, construction, electric vehicles and data centres.
Copper is often called “Dr. Copper” because traders see it as a signal of global industrial health. When investors expect stronger construction, manufacturing or electrification demand, copper trading activity often rises.
LME Copper averaged more than 170,000 lots per day in 2025, and FIA noted stronger copper futures trading at both LME and SHFE in Q4 2025.
Copper trading volume is driven by:
- electric vehicle demand
- grid investment
- housing and construction
- China industrial activity
- mine disruptions
- AI data-centre power demand
9. Wheat
Wheat remains a major traded commodity because it is one of the world’s most important food staples.
Wheat prices are highly sensitive to weather, crop disease, export restrictions and geopolitical disruption. This makes wheat futures important for farmers, food producers, millers, exporters and traders.
In 2025, CBOT soft red winter wheat futures traded 34.5 million contracts, while KC hard red winter wheat futures traded 18.1 million contracts.
Wheat trading volume is driven by:
- Black Sea exports
- droughts and floods
- global food security
- crop-quality reports
- export restrictions
- currency movements
10. Sugar
Sugar is one of the most actively traded soft commodities. It is used in food production and can also be linked to ethanol markets, especially in Brazil.
Sugar trading volume often rises when weather, currency moves or energy prices affect the balance between sugar production and ethanol production.
ICE Sugar #11 futures traded 35.5 million contracts in 2025, ahead of Coffee C futures by volume in the US agricultural softs category.
Sugar trading volume is driven by:
- Brazil sugarcane output
- India export policy
- ethanol prices
- weather in key producing regions
- global food demand
- currency movements
Why Is Oil the Most Traded Commodity?
Oil is the most traded commodity because it is essential to transport, industry, inflation and global energy security.
Crude oil has a uniquely large physical and financial market. Producers hedge future output, refiners hedge input costs, airlines hedge fuel costs, shipping firms manage exposure to energy prices, and macro traders use oil to express views on inflation, growth and geopolitical risk.
Oil also has several highly liquid benchmarks. Brent and WTI futures trade across major global venues, and crude oil options give traders additional ways to manage volatility. In 2026, oil market activity remained especially high as energy markets responded to geopolitical risk, supply-chain uncertainty and changing expectations for global demand. ICE reported record open interest in commodity and energy futures and options in March 2026, including record oil futures and options open interest.
How 2026 Differs from Prior Years
Commodity trading in 2026 differs from prior years in five important ways.
1. Energy markets remain unusually active
Oil and natural gas continue to dominate commodity trading because they are directly linked to inflation, shipping, electricity prices and geopolitical risk. ICE reported record commodity and energy open interest in March 2026, including record oil and natural gas futures and options open interest.
2. Commodity derivatives volume entered 2026 from a stronger base
Global commodity futures and options volume rose sharply in 2025. WFE reported 12.49 billion commodity futures and options contracts traded in 2025, up 17.5% from 2024.
3. Micro and smaller contracts gained importance
Smaller contracts made commodity markets more accessible to active retail traders. CME reported a record annual Micro Gold futures ADV and a record December Micro Silver futures ADV in 2025.
4. Metals trading became more tied to electrification and AI infrastructure
Copper, aluminium and silver are increasingly linked to electric vehicles, renewable energy, power grids and data centres. This has added a structural demand story to markets that were previously driven mainly by traditional manufacturing and construction cycles.
5. Agricultural markets remained sensitive to weather and policy
Corn, soybeans, wheat and sugar continue to react to weather, crop reports, export restrictions and biofuel policy. CME also expanded weekly options for grains and oilseeds in 2025, giving traders more ways to manage short-term event risk around agricultural reports.
Most Traded Commodities by Category
| Asset class | Most traded commodities | Why traders follow them |
|---|---|---|
| Energy | Crude oil, natural gas, refined products | High volatility, global demand, OPEC+ policy, storage data, geopolitical risk |
| Precious metals | Gold, silver | Inflation hedging, safe-haven demand, interest rates, retail participation |
| Base metals | Aluminium, copper, zinc, nickel | Manufacturing, construction, EVs, power grids, tariffs, China demand |
| Agriculture | Soybeans, soybean meal, corn, wheat | Food security, feed demand, weather, crop reports, trade flows |
| Soft commodities | Sugar, coffee, cotton, cocoa | Weather, harvest cycles, currency moves, export policy, supply shortages |
How to Trade Commodities
There are several ways to trade commodities. The right method depends on your experience, risk tolerance, capital and preferred market access.
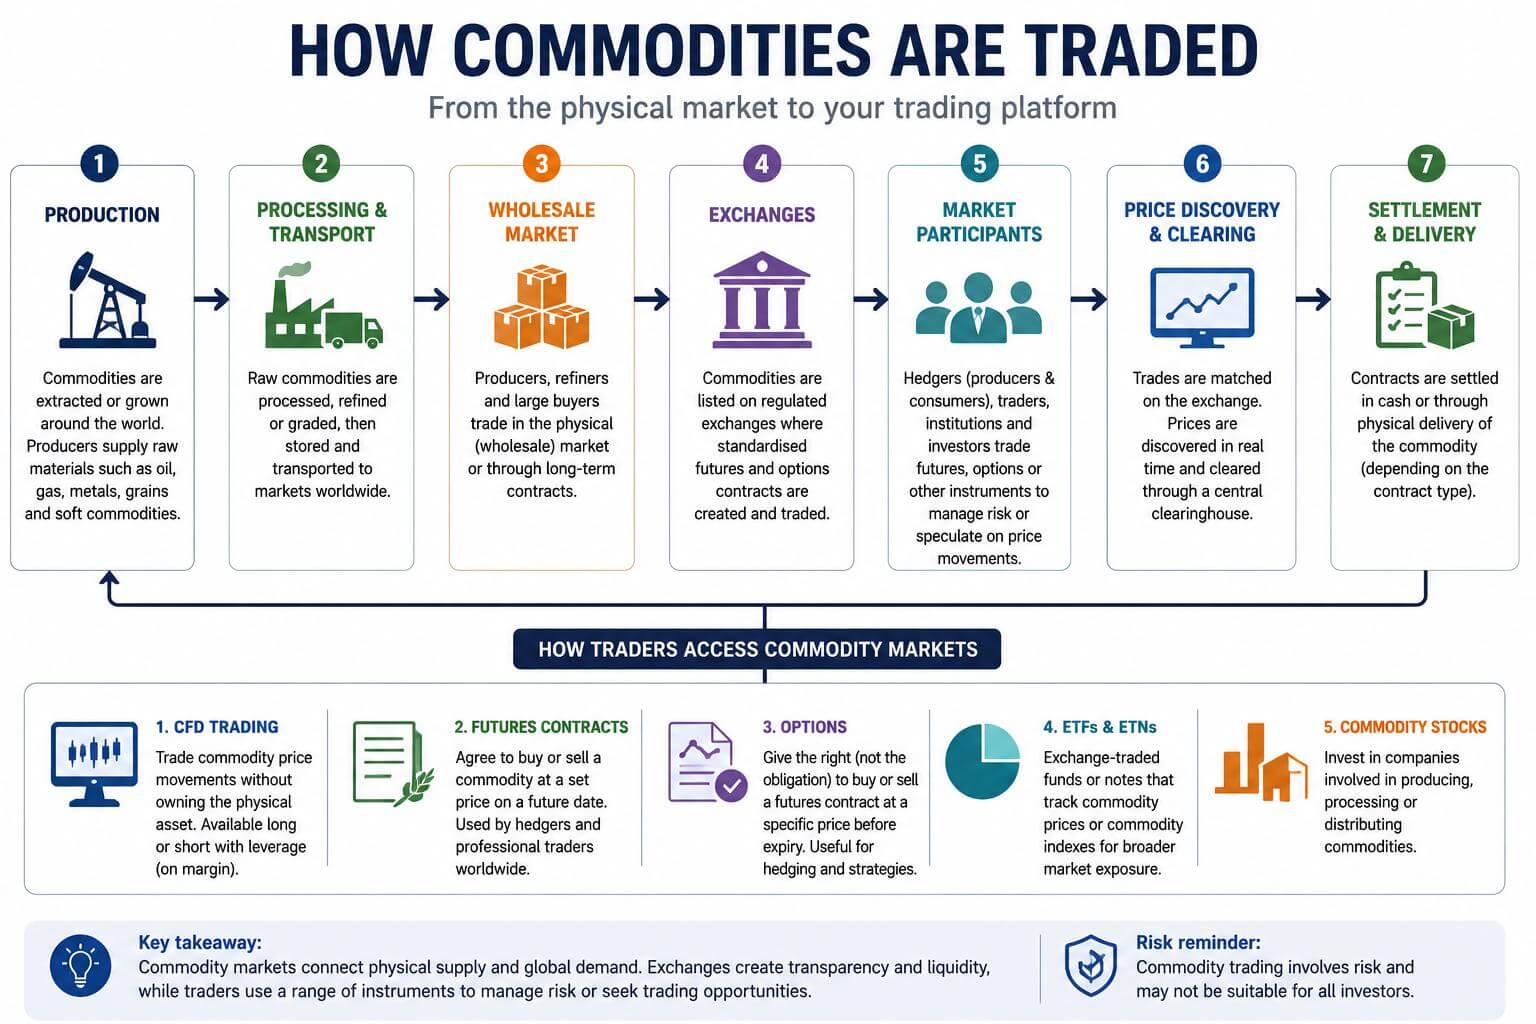
1. Commodity CFDs
Commodity CFDs allow traders to speculate on rising or falling commodity prices without owning the physical commodity. This can make CFDs more accessible than direct futures trading for many retail traders.
With Hantec Markets, traders can access commodity CFDs through global trading platforms, with markets including instruments such as US oil, UK oil, natural gas, aluminium and copper, depending on account type and regional availability. Hantec Markets also explains that commodity CFDs allow traders to speculate on commodity price movements without owning the physical asset.
2. Futures contracts
Futures are standardised exchange-traded contracts to buy or sell a commodity at a set price on a future date. They are widely used by producers, consumers, institutions and professional traders.
Futures can offer deep liquidity, but they also require strong knowledge of margin, contract size, expiry dates and rollover risk.
3. Options on commodities
Commodity options give the buyer the right, but not the obligation, to buy or sell a futures contract at a specific price before expiry.
Options are often used for hedging, event-risk trading and volatility strategies. They can be useful, but they are more complex than CFDs or simple futures positions.
4. Commodity ETFs
Commodity ETFs track the price of a commodity or a basket of commodities. They can suit longer-term investors who want exposure through a stock-exchange product.
However, ETFs may have management fees, tracking differences and rollover effects depending on how the fund is structured.
5. Commodity stocks
Another way to gain commodity exposure is through shares of mining, energy or agricultural companies.
This method is not the same as trading the commodity itself. Company shares are affected by management decisions, debt, production costs, regulation and equity-market sentiment.
Risk Management When Trading Commodities
Commodity markets can move quickly. Prices can react sharply to weather, inventory data, central-bank decisions, war, sanctions, tariffs and supply disruptions.
Before trading commodities, consider these risk-management steps:
- Use a trading plan before entering a position.
- Set stop-loss and take-profit levels.
- Avoid overusing leverage.
- Track key data releases such as oil inventories, crop reports and inflation data.
- Monitor expiry dates if trading futures or futures-linked products.
- Practise on a demo account before trading with real funds.
- Trade position sizes that match your risk tolerance.
CFDs are leveraged products and can result in losses that exceed expectations if risk is not managed carefully.
Key Takeaways
- Crude oil is the most traded commodity in 2026, followed by natural gas and gold.
- Energy markets dominate because oil and gas are essential to the global economy and are heavily used for hedging.
- Gold and silver remain highly active because traders use them for safe-haven exposure, inflation hedging and macro trading.
- Aluminium often trades more contracts than copper because it has broader industrial turnover and a lower price per tonne.
- Agricultural commodities such as soybean meal, corn, wheat and sugar continue to attract high volume because weather, food demand and government policy can quickly affect prices.
- Traders can access commodities through CFDs, futures, options, ETFs and commodity-related shares. Hantec Markets provides access to commodity CFD trading for traders who want to speculate on price movements without owning the underlying physical commodity.
Frequently Asked Questions
Why is crude oil the most traded commodity?
Crude oil is the most traded commodity because it is essential for transport, energy, petrochemicals and inflation. The scale of physical oil consumption creates constant hedging demand, while WTI and Brent futures attract global institutional and speculative trading.
Why does oil outrank gold?
Oil outranks gold because oil is consumed every day and must be continuously produced, shipped, refined and hedged. Gold is highly liquid and widely traded, but much of the world’s gold is stored rather than consumed, so its physical turnover is lower than oil’s.
Why does aluminium volume exceed copper?
Aluminium volume often exceeds copper because aluminium is cheaper per tonne and widely used across packaging, transport, construction and manufacturing. LME Aluminium averaged more than 268,000 lots per day in 2025, compared with more than 170,000 lots per day for LME Copper.
Which commodities are gaining trading volume?
Silver, gold, natural gas, copper, aluminium and agricultural options are among the commodities seeing stronger trading interest. Growth has been driven by energy volatility, retail participation in smaller metals contracts, electrification demand and the expansion of short-duration options.
What are the most liquid commodities?
The most liquid commodities are crude oil, natural gas, gold, silver, aluminium, copper, soybeans and corn. These markets usually have high trading volume, tight bid-ask spreads, strong open interest and broad participation from hedgers, institutions and active traders.
Is gold more liquid than silver?
Gold is generally more liquid in notional value and global macro trading, while silver can record very high contract volumes because of smaller contract sizes and strong retail participation. In practice, both gold and silver are highly active precious-metal markets.
Is coffee one of the most traded commodities?
Coffee is an important soft commodity, but it does not usually rank above larger energy, metals and grain markets by exchange-traded volume. Coffee volume can rise sharply during supply shocks, weather events and periods of tight inventories.
What is the best commodity to trade?
There is no single best commodity to trade. Crude oil and gold are popular because they are liquid and widely followed, while natural gas, silver, copper and agricultural markets may offer more volatility. The best choice depends on your strategy, risk tolerance and knowledge of the market.
Can beginners trade commodities?
Beginners can trade commodities, but they should start with education, a demo account and strict risk management. Commodities can be volatile, especially when markets react to weather, war, inflation data, inventory reports or central-bank decisions.
Sources
This article draws on the following primary and industry sources.
- CME Group — Volume and Open Interest: cmegroup.com/market-data/volume-open-interest.html
- Intercontinental Exchange (ICE) — Historical Volumes: ice.com/report/7
- London Metal Exchange (LME) — Monthly Volumes: lme.com/Market-data/Reports-and-data/Volumes/Monthly-volumes
- Futures Industry Association (FIA) — ETD Volume Reports: fia.org/etd-volume-reports
- World Federation of Exchanges (WFE) — Commodity Derivatives Trends: focus.world-exchanges.org/articles/trends-commodity-derivatives
- Shanghai Futures Exchange (SHFE): shfe.com.cn/eng
- Dalian Commodity Exchange (DCE): dce.com.cn
- Multi Commodity Exchange of India (MCX): mcxindia.com
Disclaimer: The content of this article is intended for informational purposes only and should not be considered professional advice.