Fibonacci (Golden Ratio) Trading Strategy
Introduction to Fibonacci Trading Strategy
The Fibonacci trading strategy is a method of analyzing and making trades based on the Fibonacci sequence, which is a series of numbers in which each number is the sum of the two preceding ones (0, 1, 1, 2, 3, 5, 8, 13, 21, 34, etc.). Traders in finance employ Fibonacci retracements to determine probable levels of support and resistance in the price movement of an asset. These levels are determined by calculating the vertical distances between the high and low points of an asset’s price, and then dividing these distances by key Fibonacci ratios (23.6%, 38.2%, 50%, 61.8%, and 100%). If a price retraces to one of these levels after a significant move up or down, it may indicate a potential change in trend, and traders may use this information to make buying or selling decisions.
Origins of Fibonacci or the “Golden Ratio”
The origin of Fibonacci numbers and the golden ratio can be traced back to the ancient mathematician Leonardo of Pisa, also known as Fibonacci. In his book “Liber Abaci,” published in 1202, he introduced the sequence of numbers now known as the Fibonacci sequence. The sequence starts with 0 and 1, and each subsequent number is the sum of the two preceding numbers. This sequence appears in many natural phenomena, including the growth patterns of plants and animals.
The golden ratio is a mathematical concept that describes the relationship between two quantities where the ratio of the smaller quantity to the larger one is the same as the ratio of the larger to the sum of both. The golden ratio is approximately equal to 1.6180339887 and is denoted by the Greek letter phi (φ). The golden ratio has been observed in a variety of natural and man-made structures and is considered a universal principle of beauty and harmony.
Figures 1: How the Fibonacci series develops and the first 15 numbers in the sequence

How is Fibonacci relevant to financial markets?
The Fibonacci sequence is relevant to financial markets because it is used to identify potential levels of support and resistance for a financial asset’s price. The sequence is derived from adding the previous two numbers to get the next number, starting from 0 and 1. In technical analysis, traders and investors use Fibonacci retracements to identify levels at which an asset’s price may experience support or resistance after a price move. These levels are determined by calculating the percentage retracement of the price move and finding the corresponding level in the Fibonacci sequence. The most commonly used levels are 23.6%, 38.2%, 50%, 61.8% and 100%. These levels are considered significant because they often correspond to key psychological levels in trading and can serve as potential areas for traders to enter or exit positions.
Fibonacci retracement and extension
Fibonacci retracement and extension is a technical analysis tool that uses horizontal lines to identify potential levels of support and resistance in an asset’s price movement. By plotting the price swings from high to low, traders can use the Fibonacci ratio of 23.6%, 38.2%, 50%, 61.8%, and 100% to forecast where the price may retrace or extend to. The Fibonacci retracement levels are used to determine the support levels, while the Fibonacci extension levels are used to identify potential profit-taking levels. These levels are widely used in forex, stocks, and cryptocurrency trading to make informed trading decisions and increase the chances of success.
What is Fibonacci retracement?
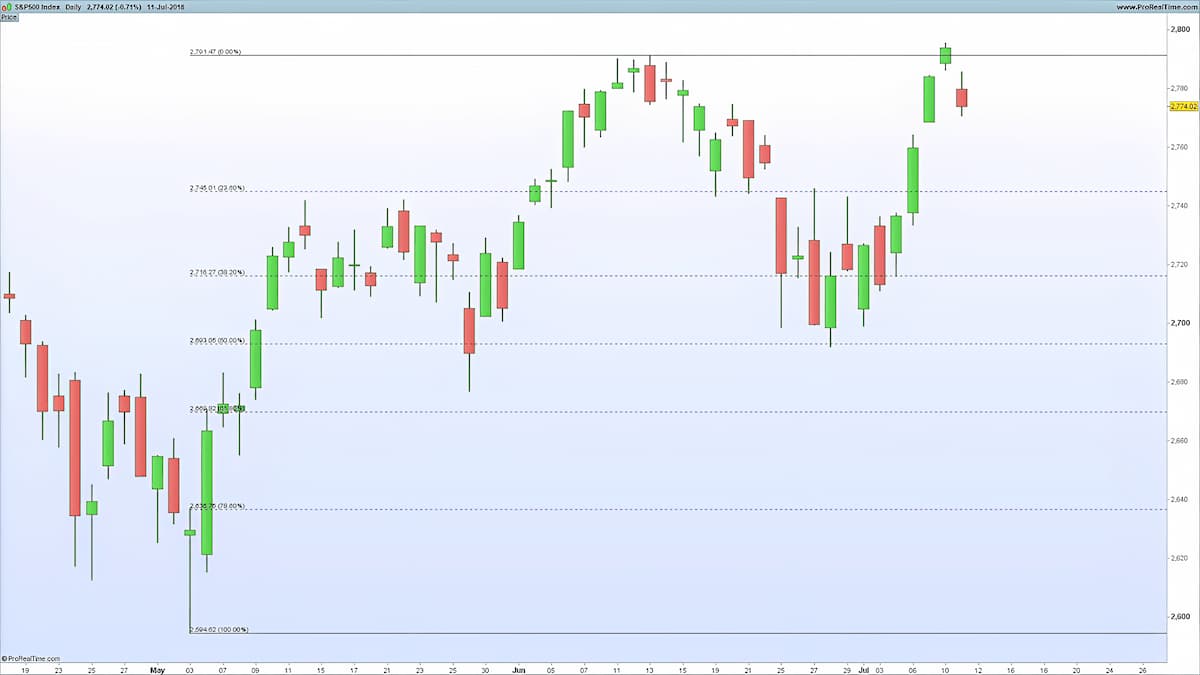
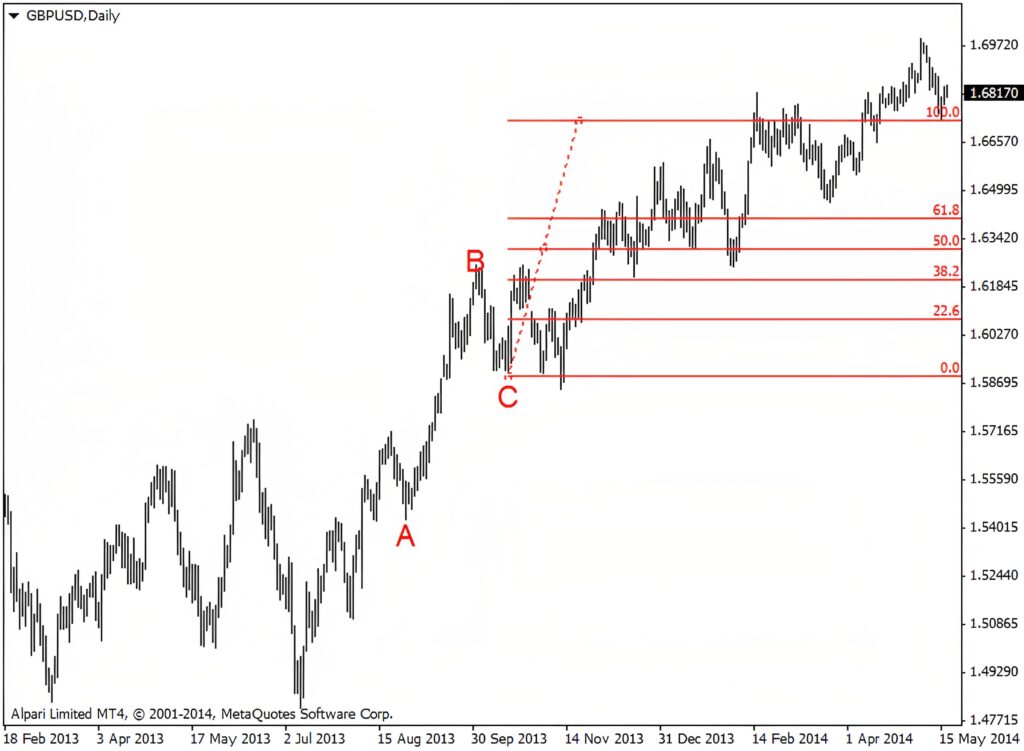
Fibonacci retracement is a technical analysis tool that uses horizontal lines to indicate areas of support or resistance at the key Fibonacci levels before the price continues in the original direction. The most commonly used Fibonacci retracement levels are 38.2%, 50%, and 61.8%. The Fibonacci retracement level gives technical traders a good edge in the market. The Fibonacci retracement tool is one of the most common trading tools on charting software – MT4.
For example, let’s say an asset is trading at $100, and over a period of time, the price rises to $150. To plot the retracement levels, you would first find the difference between the high and low prices: $150 – $100 = $50. Then, you would multiply that difference by the key Fibonacci ratios (0.382, 0.5, and 0.618) and add the result to the low price.
38.2% retracement level: $100 + ($50 x 0.382) = $119.10
50% retracement level: $100 + ($50 x 0.5) = $125
61.8% retracement level: $100 + ($50 x 0.618) = $130.90
These levels would then be plotted on a chart horizontally and used as potential areas of support or resistance. If the price of the asset were to retrace and reach one of these levels, traders may consider entering a long or short position, depending on the direction of the price movement.
Figure 2: Fibonacci retracements in use
What is Fibonacci Extension?
Fibonacci extensions are technical analysis tools used to identify potential levels of support and resistance levels in financial markets. The extensions are based on the Fibonacci sequence, which is a series of numbers where each number is the sum of the two preceding ones (0, 1, 1, 2, 3, 5, 8, 13, 21, etc.). In technical analysis, the most commonly used Fibonacci levels are 0.0%, 23.6%, 38.2%, 50.0%, 61.8%, and 100.0%.
Here’s an example of how Fibonacci extensions can be used in currency trading:
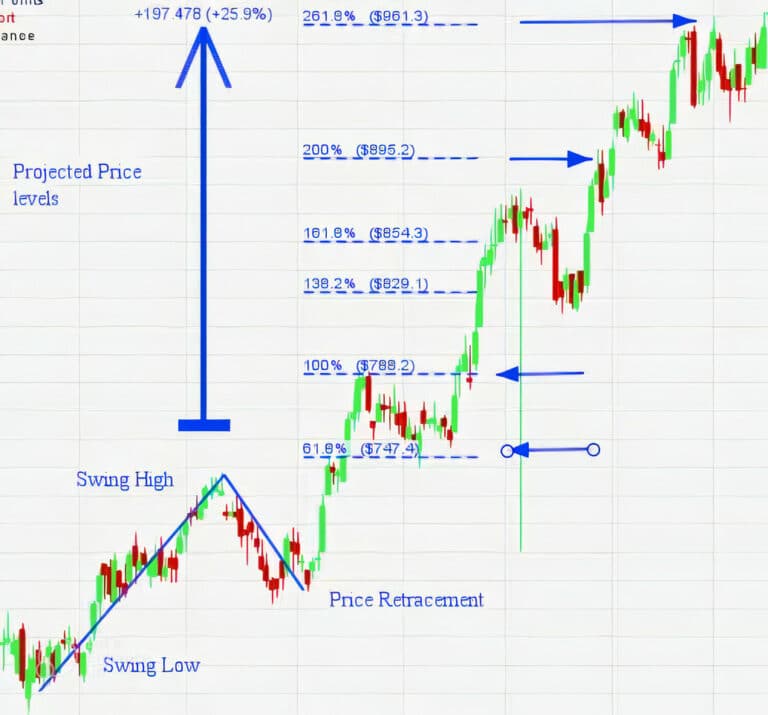
Let’s say you want to trade XYZ stock. After analyzing the charts, you determine that the stock has recently made a significant move from $100 to $150. You can use Fibonacci extensions to determine where the stock may find support or resistance on its next move.
Plot the Fibonacci extension from the swing low to swing high, which in this case is from $100 to $150.
The 38.2% extension level is calculated by multiplying the difference between the swing high and swing low by 0.382 and then adding the result to the swing low. In this case, that level is $119.1.
The 50.0% extension level is calculated by multiplying the difference between the swing high and swing low by 0.5 and then adding the result to the swing low. In this case, that level is $125.
The 61.8% extension level is calculated by multiplying the difference between the swing high and swing low by 0.618 and then adding the result to the swing low. In this case, that level is $130.9.
If the stock approaches one of these levels, traders may take this as an opportunity to enter a trade, as the stock may find support at the level and bounce back up. However, if the stock breaks through these levels, traders may consider exiting their positions, as this could signal that the stock is losing momentum.
Figure 3: Fibonacci Extension
How to use Fibonacci retracements in trading
Here’s how to use Fibonacci retracement in trading.
Identify the high and low points: Find the significant high and low points of the asset’s price movement.
Plot the Fibonacci retracement levels: Use a charting tool to plot the Fibonacci retracement levels between the high and low points. The levels are derived from the Fibonacci sequence and include 23.6%, 38.2%, 50%, 61.8%, and 100%.
Look for potential support and resistance levels: As prices retrace, they may encounter support or resistance at one of the Fibonacci levels.
Make trading decisions: If prices break through a support or resistance level, traders may look to enter or exit a trade accordingly.
Example using Gold:
Suppose the price of gold had a significant move from $1,500 to $1,800. The low point would be $1,500 and the high point would be $1,800.
After plotting the Fibonacci retracement levels, a trader might observe that the price of gold is finding support at the 50% retracement level, which is near $1,650. The trader might then consider entering a long position in gold, with a stop loss order placed below the 50% Fibonacci level.
Fibonacci Projections
Fibonacci projection is a technical analysis tool that uses the Fibonacci sequence to predict potential levels of support and resistance in the future price movement of an asset. The Fibonacci sequence is a series of numbers where each number is the sum of the two preceding numbers, starting with 0 and 1. By plotting these numbers on a chart, traders can identify key levels where the asset price may experience resistance or support.
Fibonacci projections are used by traders in forex, stocks, commodities, and other financial markets to make informed investment decisions. The key levels identified by the Fibonacci projection tool can help traders determine potential entry and exit points, as well as set stop-loss orders.
Investors use Fibonacci projections as a complementary tool along with other technical analysis indicators and fundamental analysis to make informed decisions about their investments. It is important to note that Fibonacci projections are not a guarantee of future market performance, but rather a tool to help traders make informed decisions based on past market behavior.
Overall, Fibonacci projection is a valuable tool for traders and investors looking to gain insight into potential market movements and make informed investment decisions.
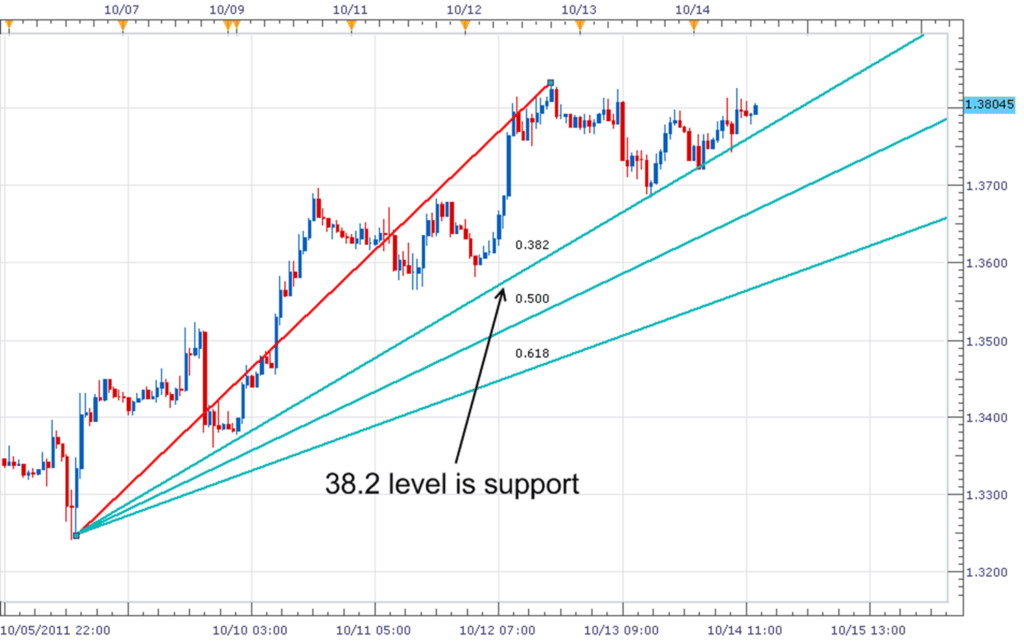
Figure 4: Fibonacci Projections
Fibonacci Fan
A Fibonacci fan is a technical analysis tool that uses Fibonacci retracement lines to identify potential levels of support and resistance in an asset’s price action. The tool is created by drawing a trendline between two extreme points and then dividing the vertical distance with the key Fibonacci ratios of 23.6%, 38.2%, 50%, 61.8% and 100%.
These Fibonacci retracement lines can then be used to identify areas where the price may potentially experience support or resistance. If the price action of the asset is trending upwards, the Fibonacci fan can be used to identify potential levels of support. Conversely, if the price action is trending downwards, the Fibonacci fan can be used to identify potential levels of resistance.
Investors and traders use Fibonacci fan as a way to make informed decisions about buying or selling an asset. The tool is particularly useful for those who follow a momentum or trend-following trading strategy, as it can help identify key levels where the trend may reverse or continue. The combination of trend analysis and Fibonacci retracement levels makes the Fibonacci fan a powerful tool for technical analysis.
Figure 5: Fibonacci Fan
Summary
The Fibonacci trading strategy is a technical analysis approach that uses mathematical relationships between successive Fibonacci numbers to identify potential levels of support and resistance in an asset’s price action. This approach is based on the idea that prices tend to retrace a predictable portion of a move, after which they will continue to move in the original direction. The strategy involves identifying key Fibonacci levels, such as the 38.2%, 50%, and 61.8% retracement levels, and using these levels to make trading decisions.
Traders using this strategy will often look for price action to confirm the validity of the Fibonacci levels by looking for price bounces or reversals at these levels. If the price action confirms the levels, traders may enter positions or adjust existing positions accordingly.
Overall, the Fibonacci trading strategy can be a useful tool for traders looking to improve their analysis and make more informed trading decisions. However, like any technical analysis approach, it should be used in conjunction with other analysis methods and should not be relied upon solely for making trading decisions.
Key Takeaways:
- The Fibonacci sequence and the Golden Ratio are mathematical concepts that can be applied to financial markets for technical analysis.
- Traders use Fibonacci retracement levels to identify potential support and resistance levels where an asset’s price may find a floor or ceiling after a significant move up or down.
- Fibonacci extensions can be used to project potential profit targets by applying the Fibonacci ratios to the previous price swing.
- Fibonacci projections help forecast future support and resistance levels by projecting the Fibonacci ratios from a significant price move.
- The Fibonacci fan uses trendlines and Fibonacci ratios to identify potential support and resistance levels in a trending market.
- Traders can use Fibonacci levels to make informed decisions about entering or exiting trades, setting stop-loss orders, and taking profits.
- Fibonacci trading strategies should be used in conjunction with other technical analysis tools and fundamental analysis, and not solely relied upon for making trading decisions.
- The Fibonacci sequence and its ratios are found in many natural phenomena, and their application in financial markets is based on the idea that prices tend to retrace a predictable portion of a move before continuing in the original direction.